Salesforce Shareholder Engagement Presentation Deck
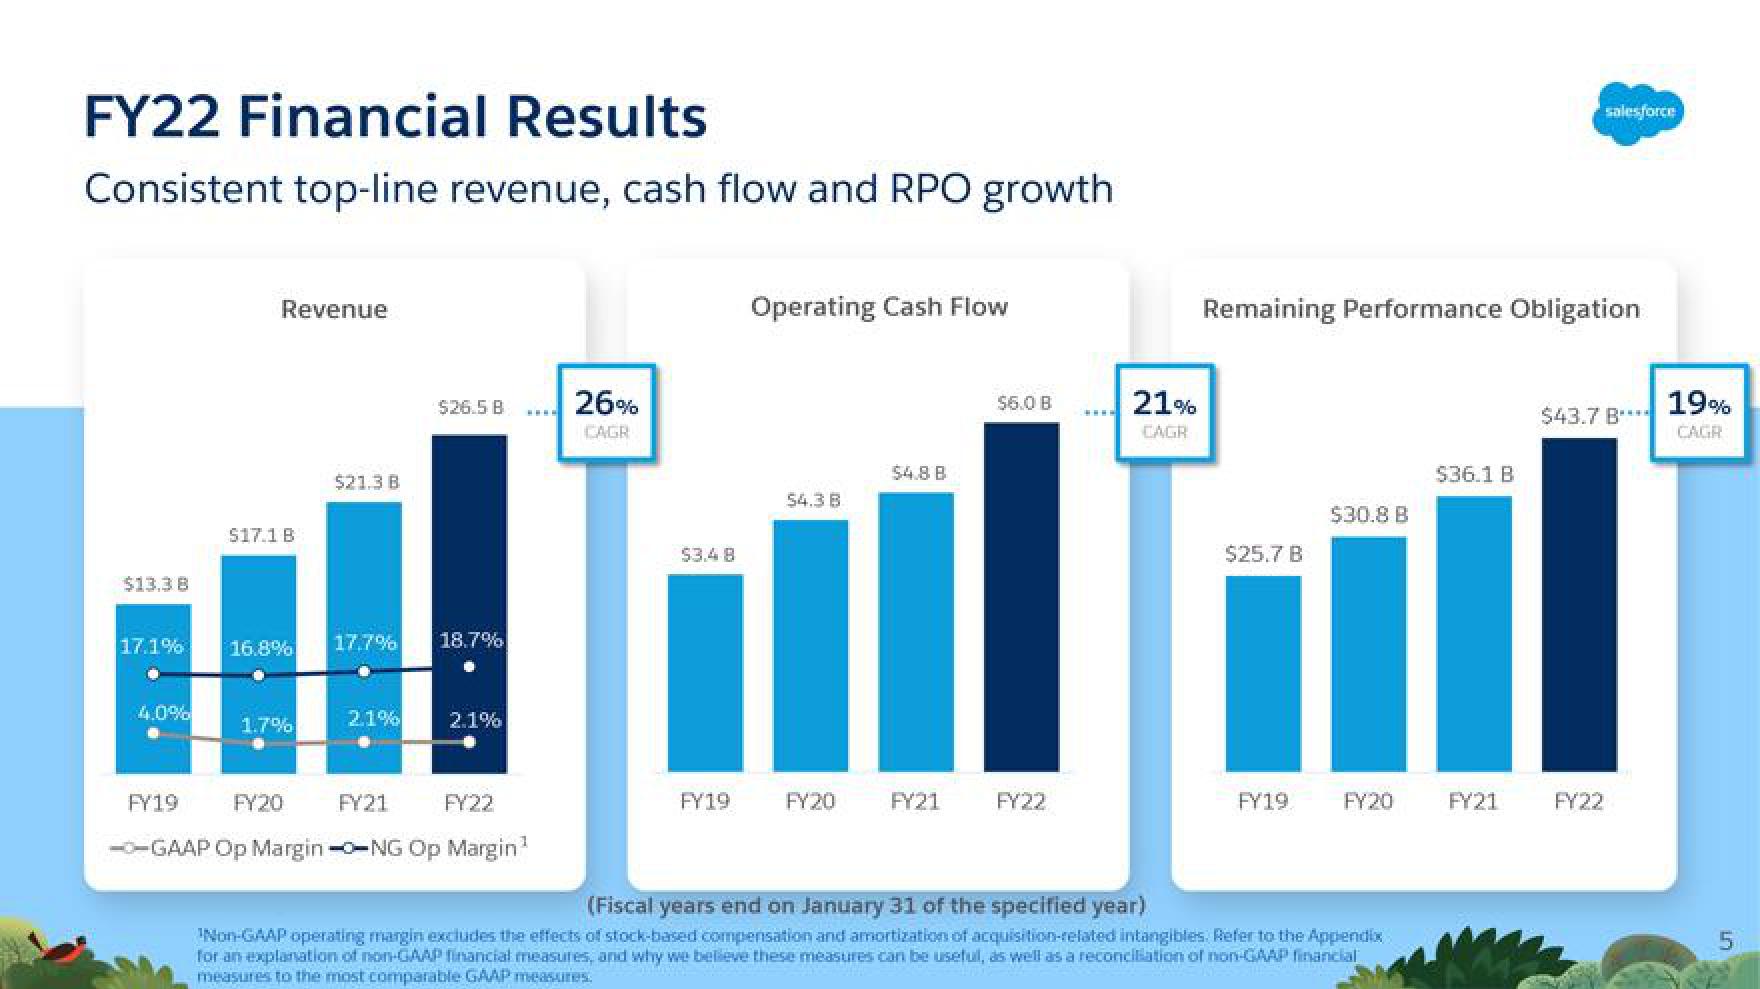
FY22 Financial Results
Consistent top-line revenue, cash flow and RPO growth
$13.3 B
17.1%
4.0%
Revenue
$17.1 B
16.8%
1.7%
FY20
$21.3 B
17,7%
2.1%
FY21
$26.5 B
18.7%
2.1%
FY19
FY22
--GAAP Op Margin-O-NG Op Margin¹
www.
26%
CAGR
$3.4 B
FY19
Operating Cash Flow
$4.3 B
FY20
$4.8 B
FY21
$6.0 B
FY22
21%
CAGR
Remaining Performance Obligation
$25.7 B
FY19
$30.8 B
FY20
(Fiscal years end on January 31 of the specified year)
¹Non-GAAP operating margin excludes the effects of stock-based compensation and amortization of acquisition-related intangibles. Refer to the Appendix
for an explanation of non-GAAP financial measures, and why we believe these measures can be useful, as well as a reconciliation of non-GAAP financial
measures to the most comparable GAAP measures.
$36.1 B
salesforce
FY21
$43.7 B****
FY22
19%
CAGR
in
5View entire presentation