XP Inc Results Presentation Deck
Retail Revenue
Retail Revenue (in R$ mn)
2,088
1Q21
+16%
2,725
4Q21
2,425
1Q22
Highlights
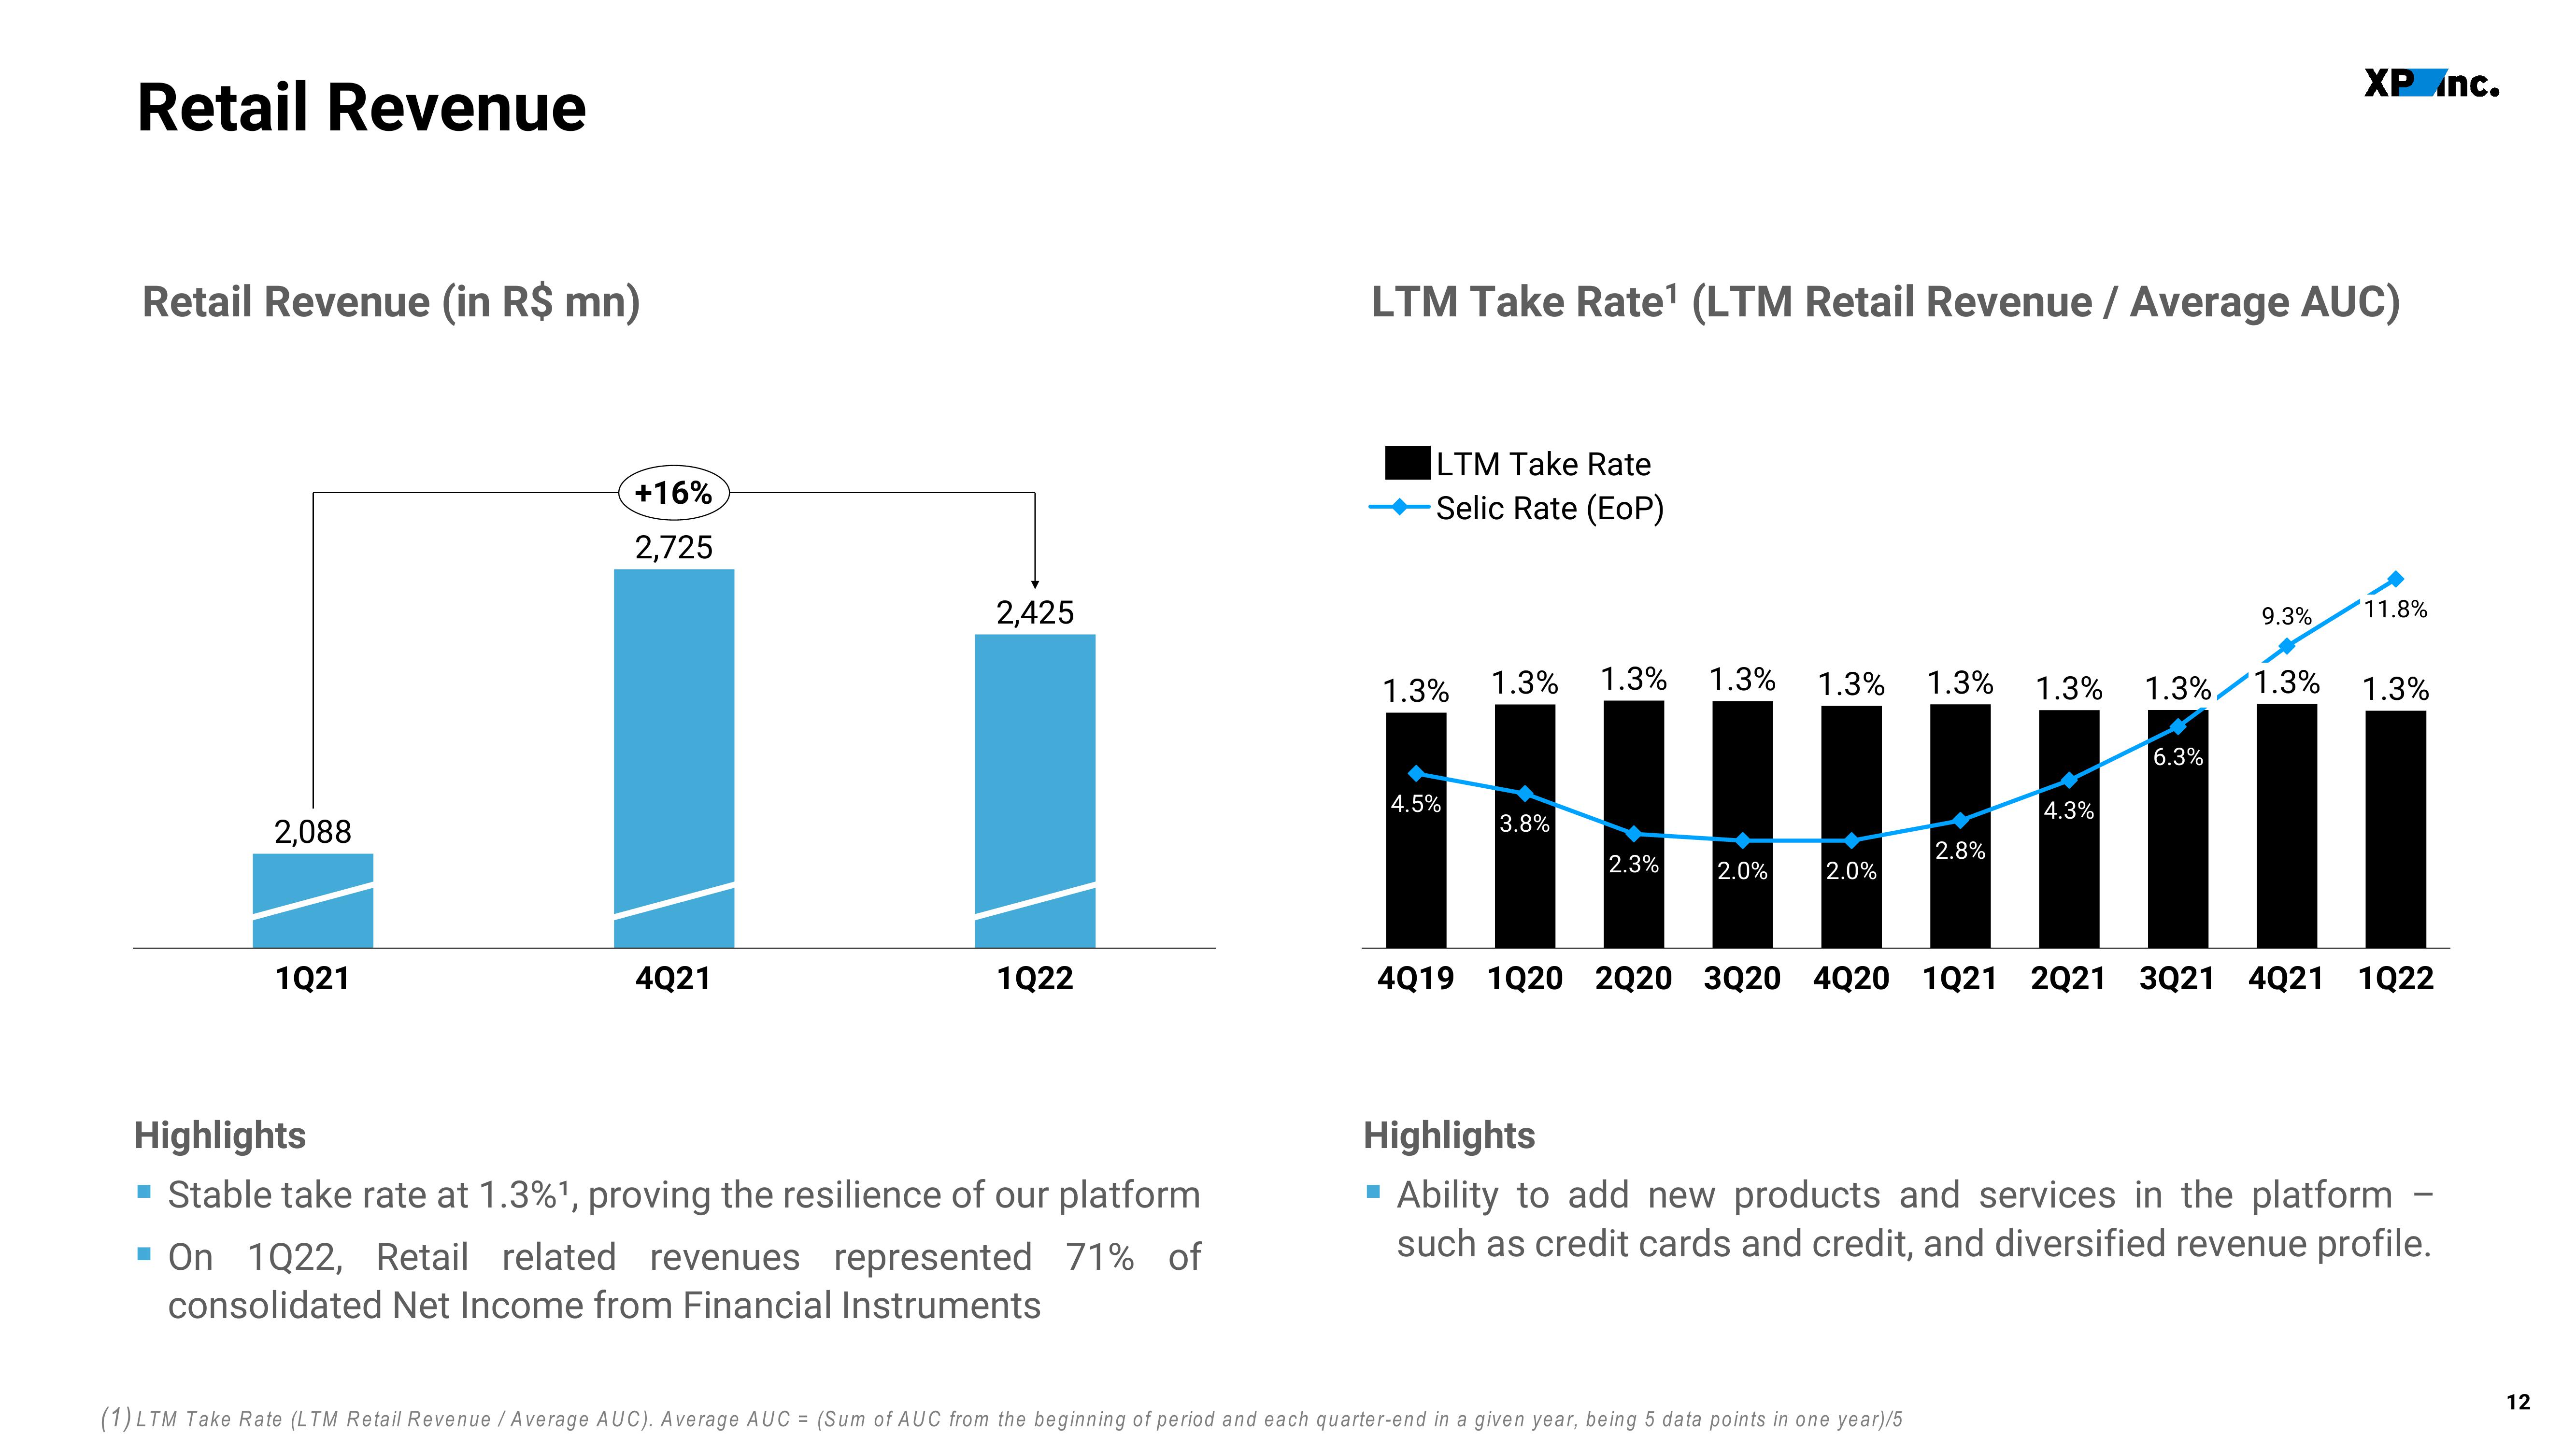
▪ Stable take rate at 1.3% ¹, proving the resilience of our platform
▪ On 1Q22, Retail related revenues represented 71% of
consolidated Net Income from Financial Instruments
LTM Take Rate¹ (LTM Retail Revenue / Average AUC)
LTM Take Rate
Selic Rate (EoP)
1.3% 1.3% 1.3%
■
4.5%
3.8%
2.3%
9.3% '11.8%
1.3% 1.3% 1.3% 1.3% 1.3% 1.3% 1.3%
2.0%
2.0%
2.8%
XP Inc.
4.3%
(1) LTM Take Rate (LTM Retail Revenue / Average AUC). Average AUC = (Sum of AUC from the beginning of period and each quarter-end in a given year, being 5 data points in one year)/5
6.3%
4Q19 1Q20 2020 3Q20 4020 1021 2021 3Q21 4Q21 1Q22
Highlights
Ability to add new products and services in the platform
such as credit cards and credit, and diversified revenue profile.
12View entire presentation