Tudor, Pickering, Holt & Co Investment Banking
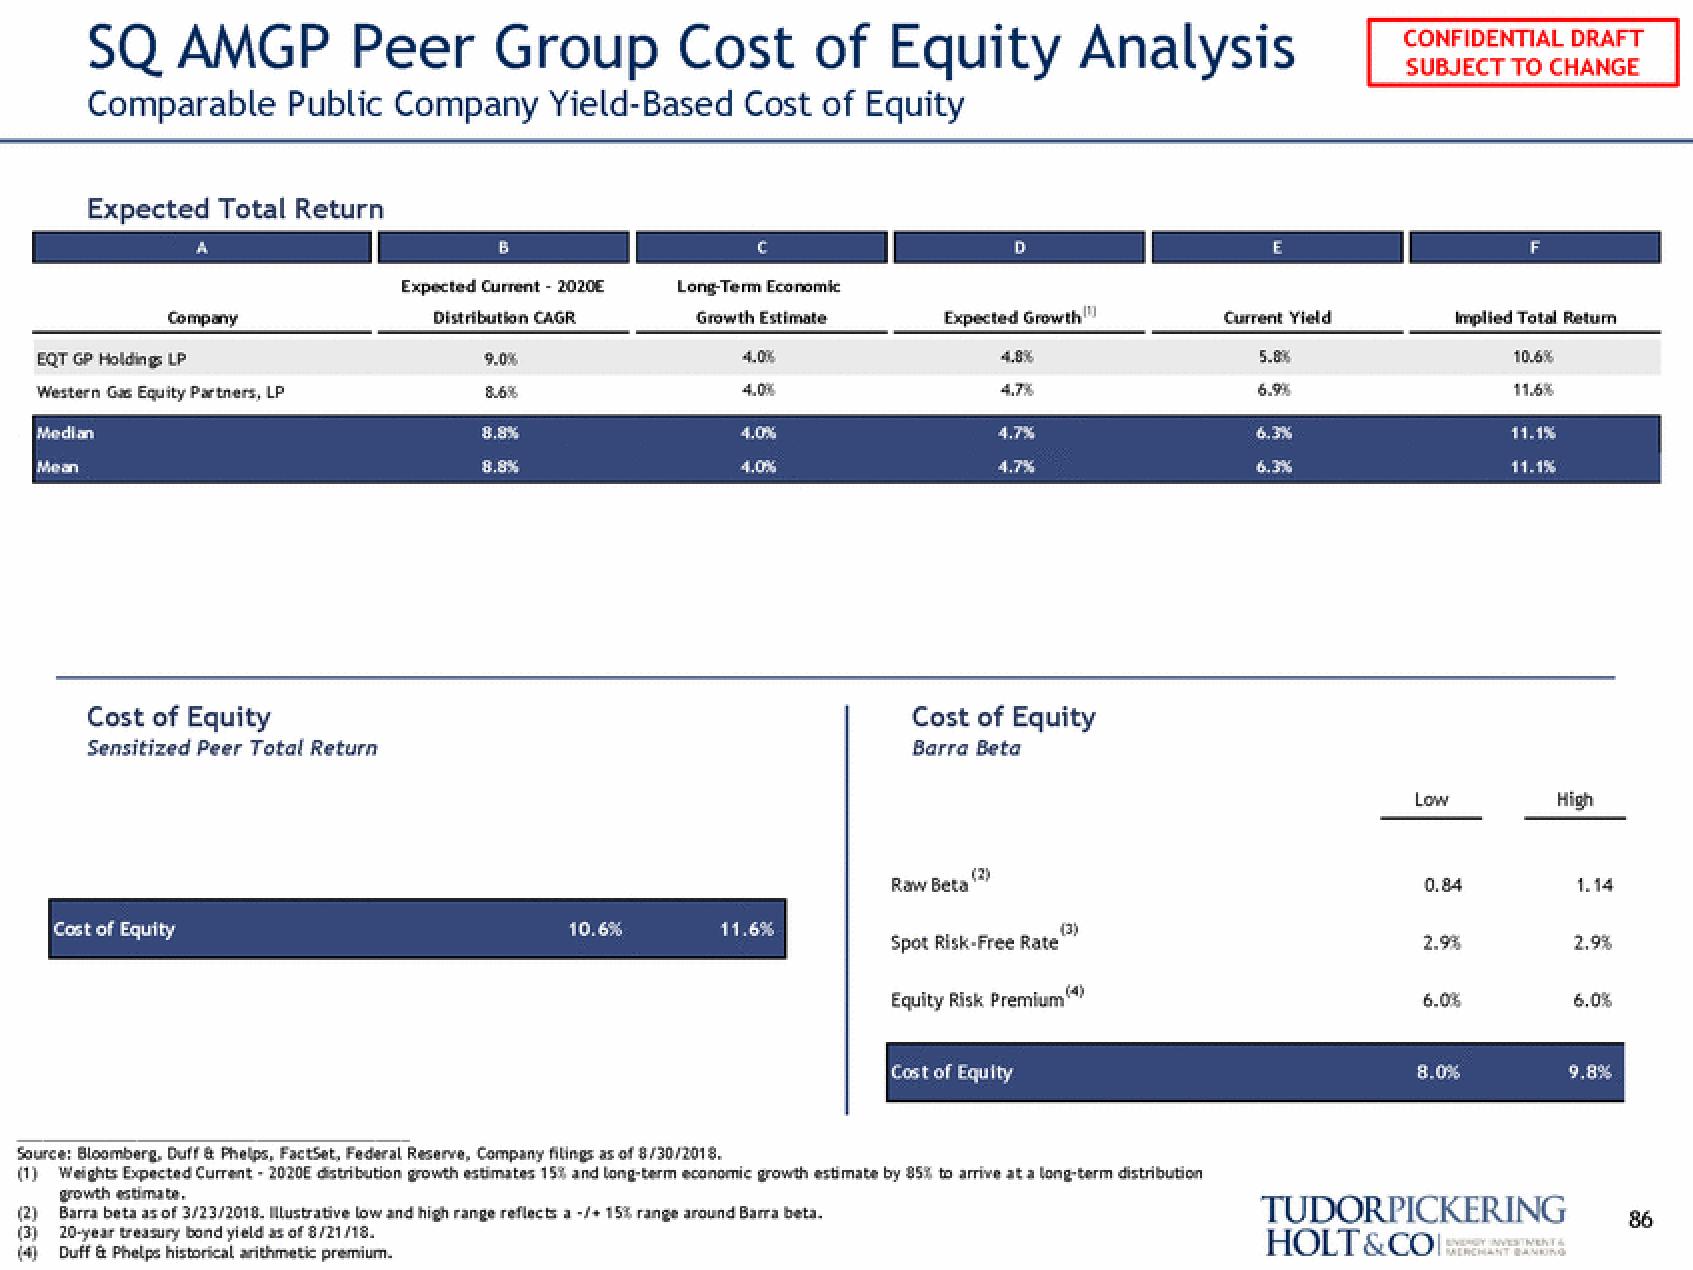
SQ AMGP Peer Group Cost of Equity Analysis
Comparable Public Company Yield-Based Cost of Equity
Expected Total Return
Mean
Median
EQT GP Holdings LP
Western Gas Equity Partners, LP
A
Company
Cost of Equity
Sensitized Peer Total Return
Cost of Equity
B
Expected Current - 2020E
Distribution CAGR
8.6%
8.8%
8.8%
10.6%
Long-Term Economic
Growth Estimate
4.00
4.0%
4.0%
11.6%
D
Expected Growth
Raw Beta
4.7%
4.7%
4.7%
Cost of Equity
Barra Beta
(3)
Spot Risk-Free Rate
Equity Risk Premium
Cost of Equity
Source: Bloomberg, Duff & Phelps, FactSet, Federal Reserve, Company filings as of 8/30/2018.
(1) Weights Expected Current - 2020E distribution growth estimates 15% and long-term economic growth estimate by 85% to arrive at a long-term distribution
growth estimate.
Barra beta as of 3/23/2018. Illustrative low and high range reflects a -/+ 15% range around Barra beta.
(3) 20-year treasury bond yield as of 8/21/18.
Duff & Phelps historical arithmetic premium.
E
Current Yield
5.8%
6.3%
CONFIDENTIAL DRAFT
SUBJECT TO CHANGE
Low
Implied Total Return
0.84
2.9%
6.0%
F
8.0%
10.6%
11.1%
11.1%
High
1.14
2.9%
6.0%
9.8%
TUDORPICKERING 86
HOLT&COCHANT BANKINGView entire presentation