Pathward Financial Results Presentation Deck
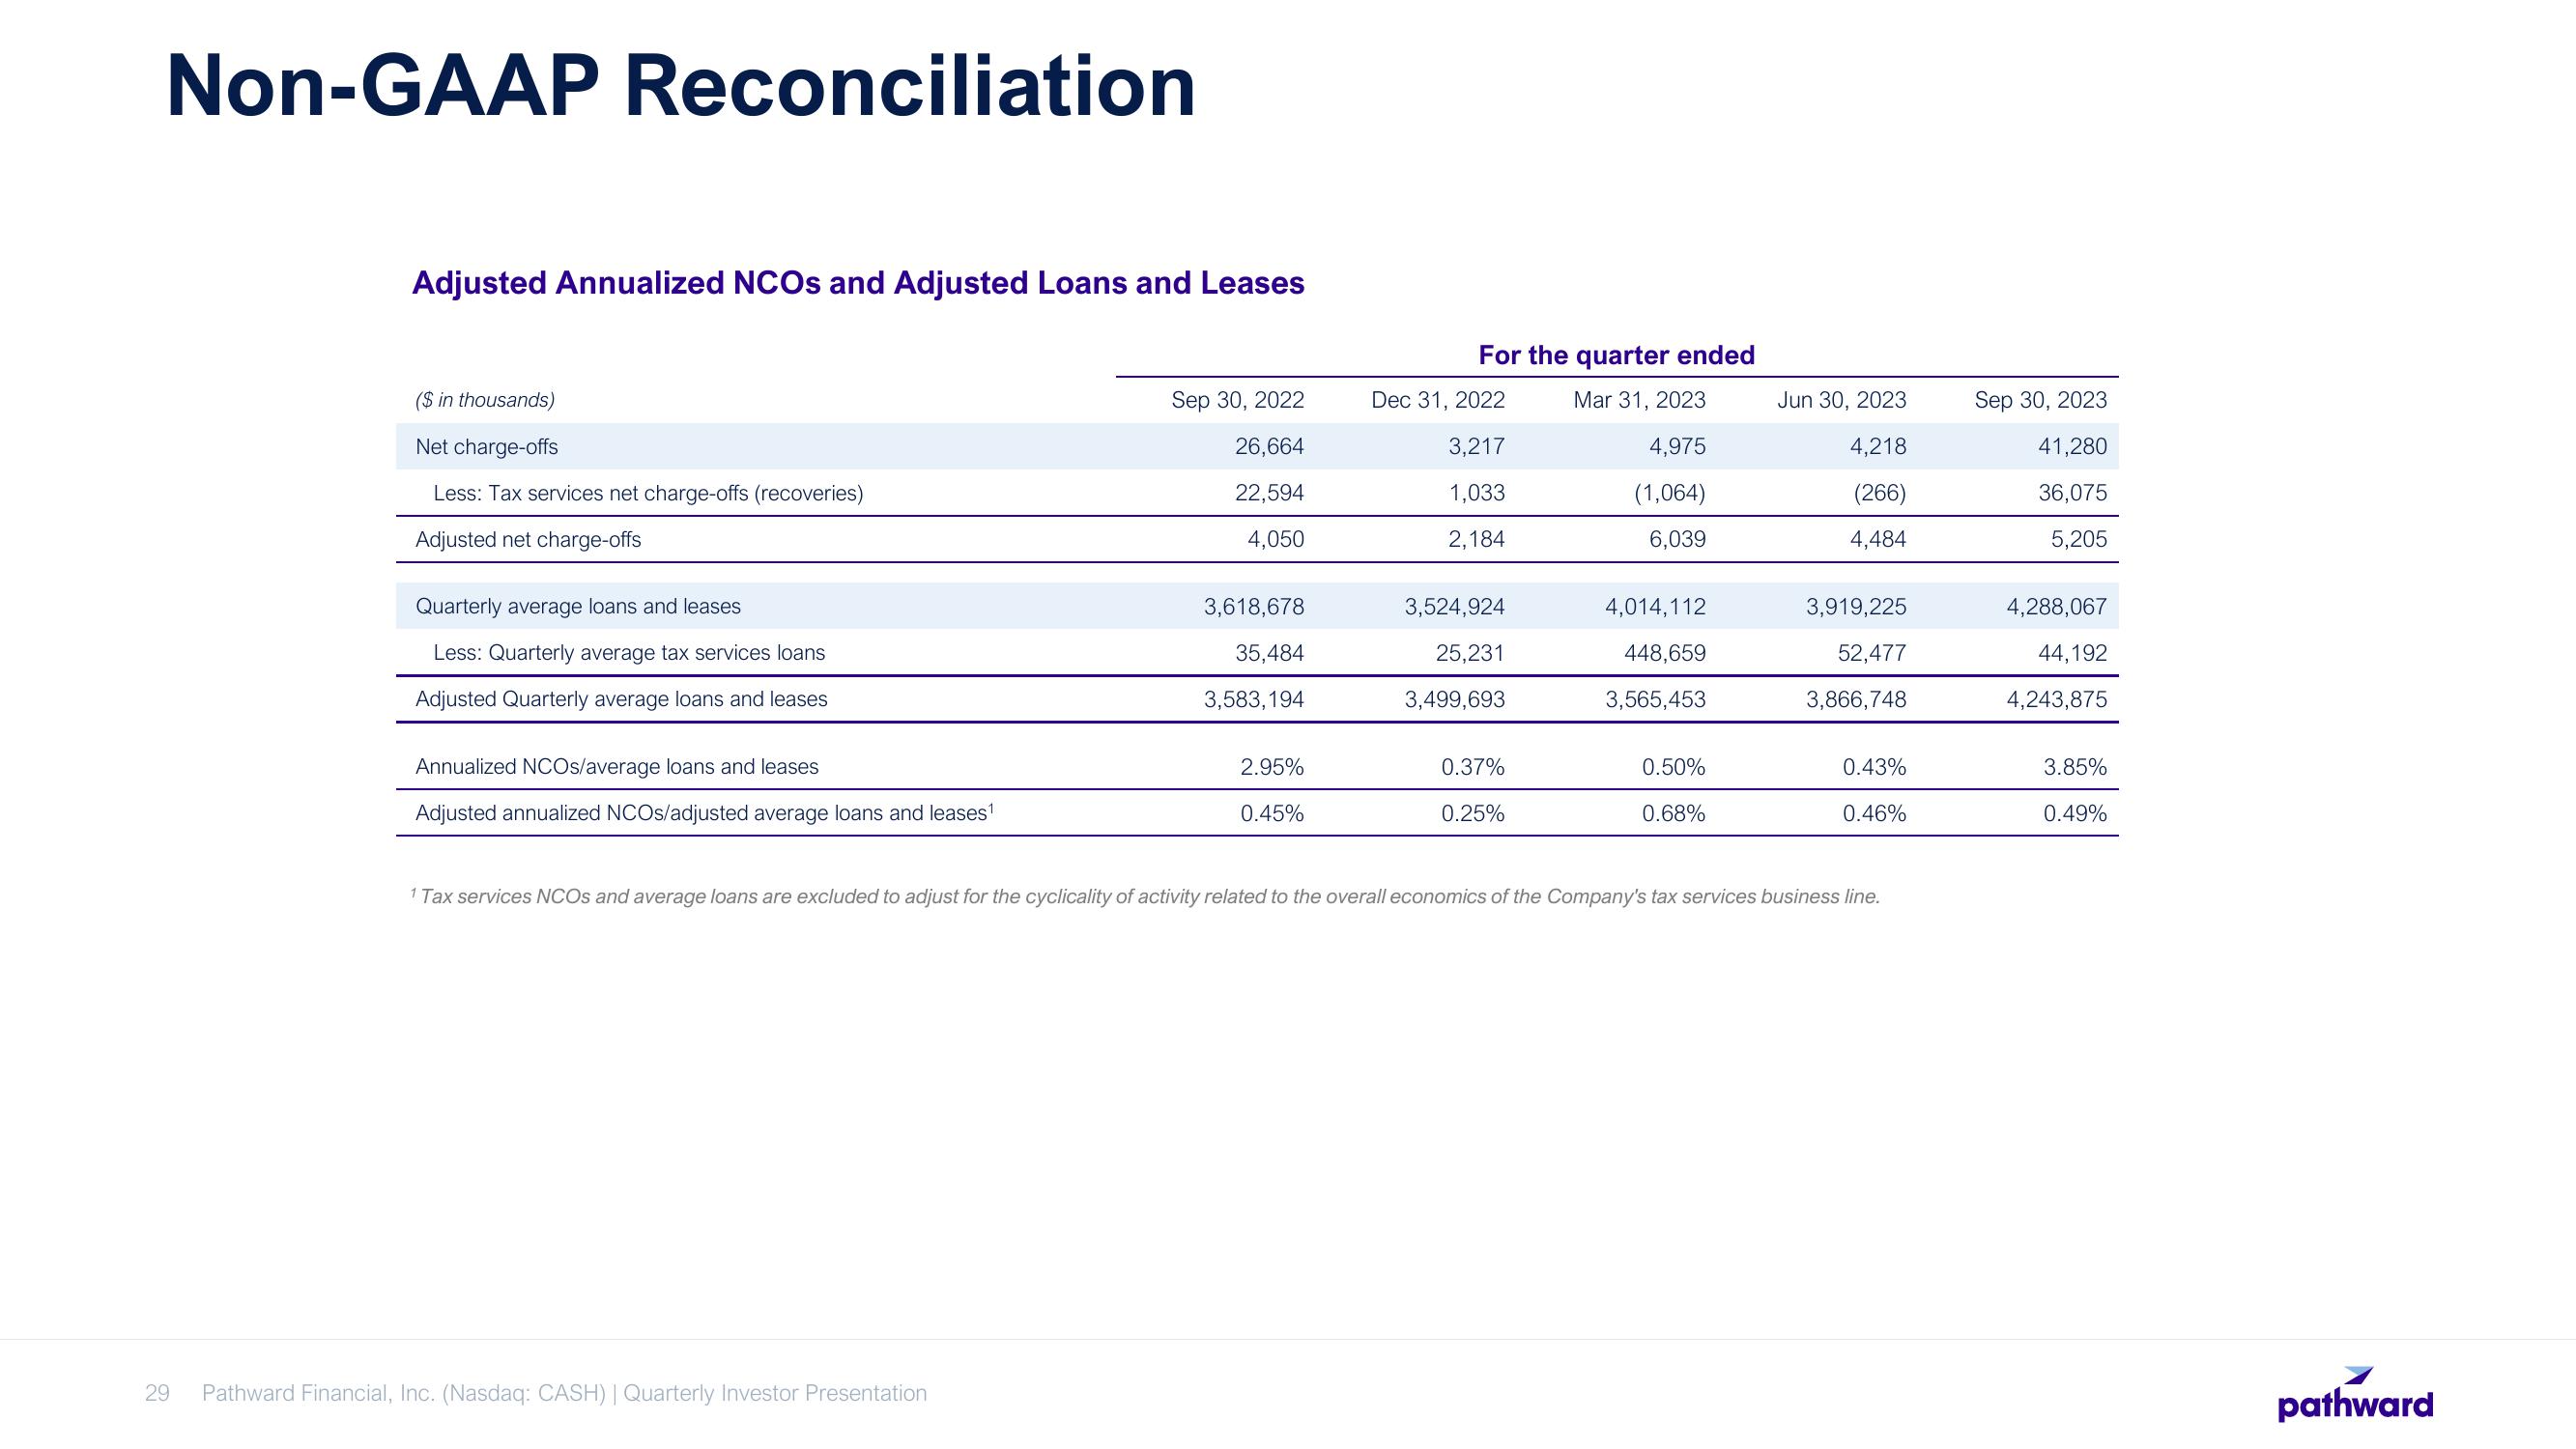
Non-GAAP Reconciliation
Adjusted Annualized NCOs and Adjusted Loans and Leases
($ in thousands)
Net charge-offs
Less: Tax services net charge-offs (recoveries)
Adjusted net charge-offs
Quarterly average loans and leases
Less: Quarterly average tax services loans
Adjusted Quarterly average loans and leases
Annualized NCOs/average loans and leases
Adjusted annualized NCOs/adjusted average loans and leases¹
Sep 30, 2022
26,664
22,594
4,050
29 Pathward Financial, Inc. (Nasdaq: CASH) | Quarterly Investor Presentation
3,618,678
35,484
3,583,194
2.95%
0.45%
For the quarter ended
Mar 31, 2023
4,975
(1,064)
6,039
Dec 31, 2022
3,217
1,033
2,184
3,524,924
25,231
3,499,693
0.37%
0.25%
4,014,112
448,659
3,565,453
0.50%
0.68%
Jun 30, 2023
4,218
(266)
4,484
3,919,225
52,477
3,866,748
0.43%
0.46%
1 Tax services NCOS and average loans are excluded to adjust for the cyclicality of activity related to the overall economics of the Company's tax services business line.
Sep 30, 2023
41,280
36,075
5,205
4,288,067
44,192
4,243,875
3.85%
0.49%
pathwardView entire presentation