Experienced Senior Team Overview
AG Direct Lending III, L.P. Update
(as of September 30, 2020)
■
■
■
■
■
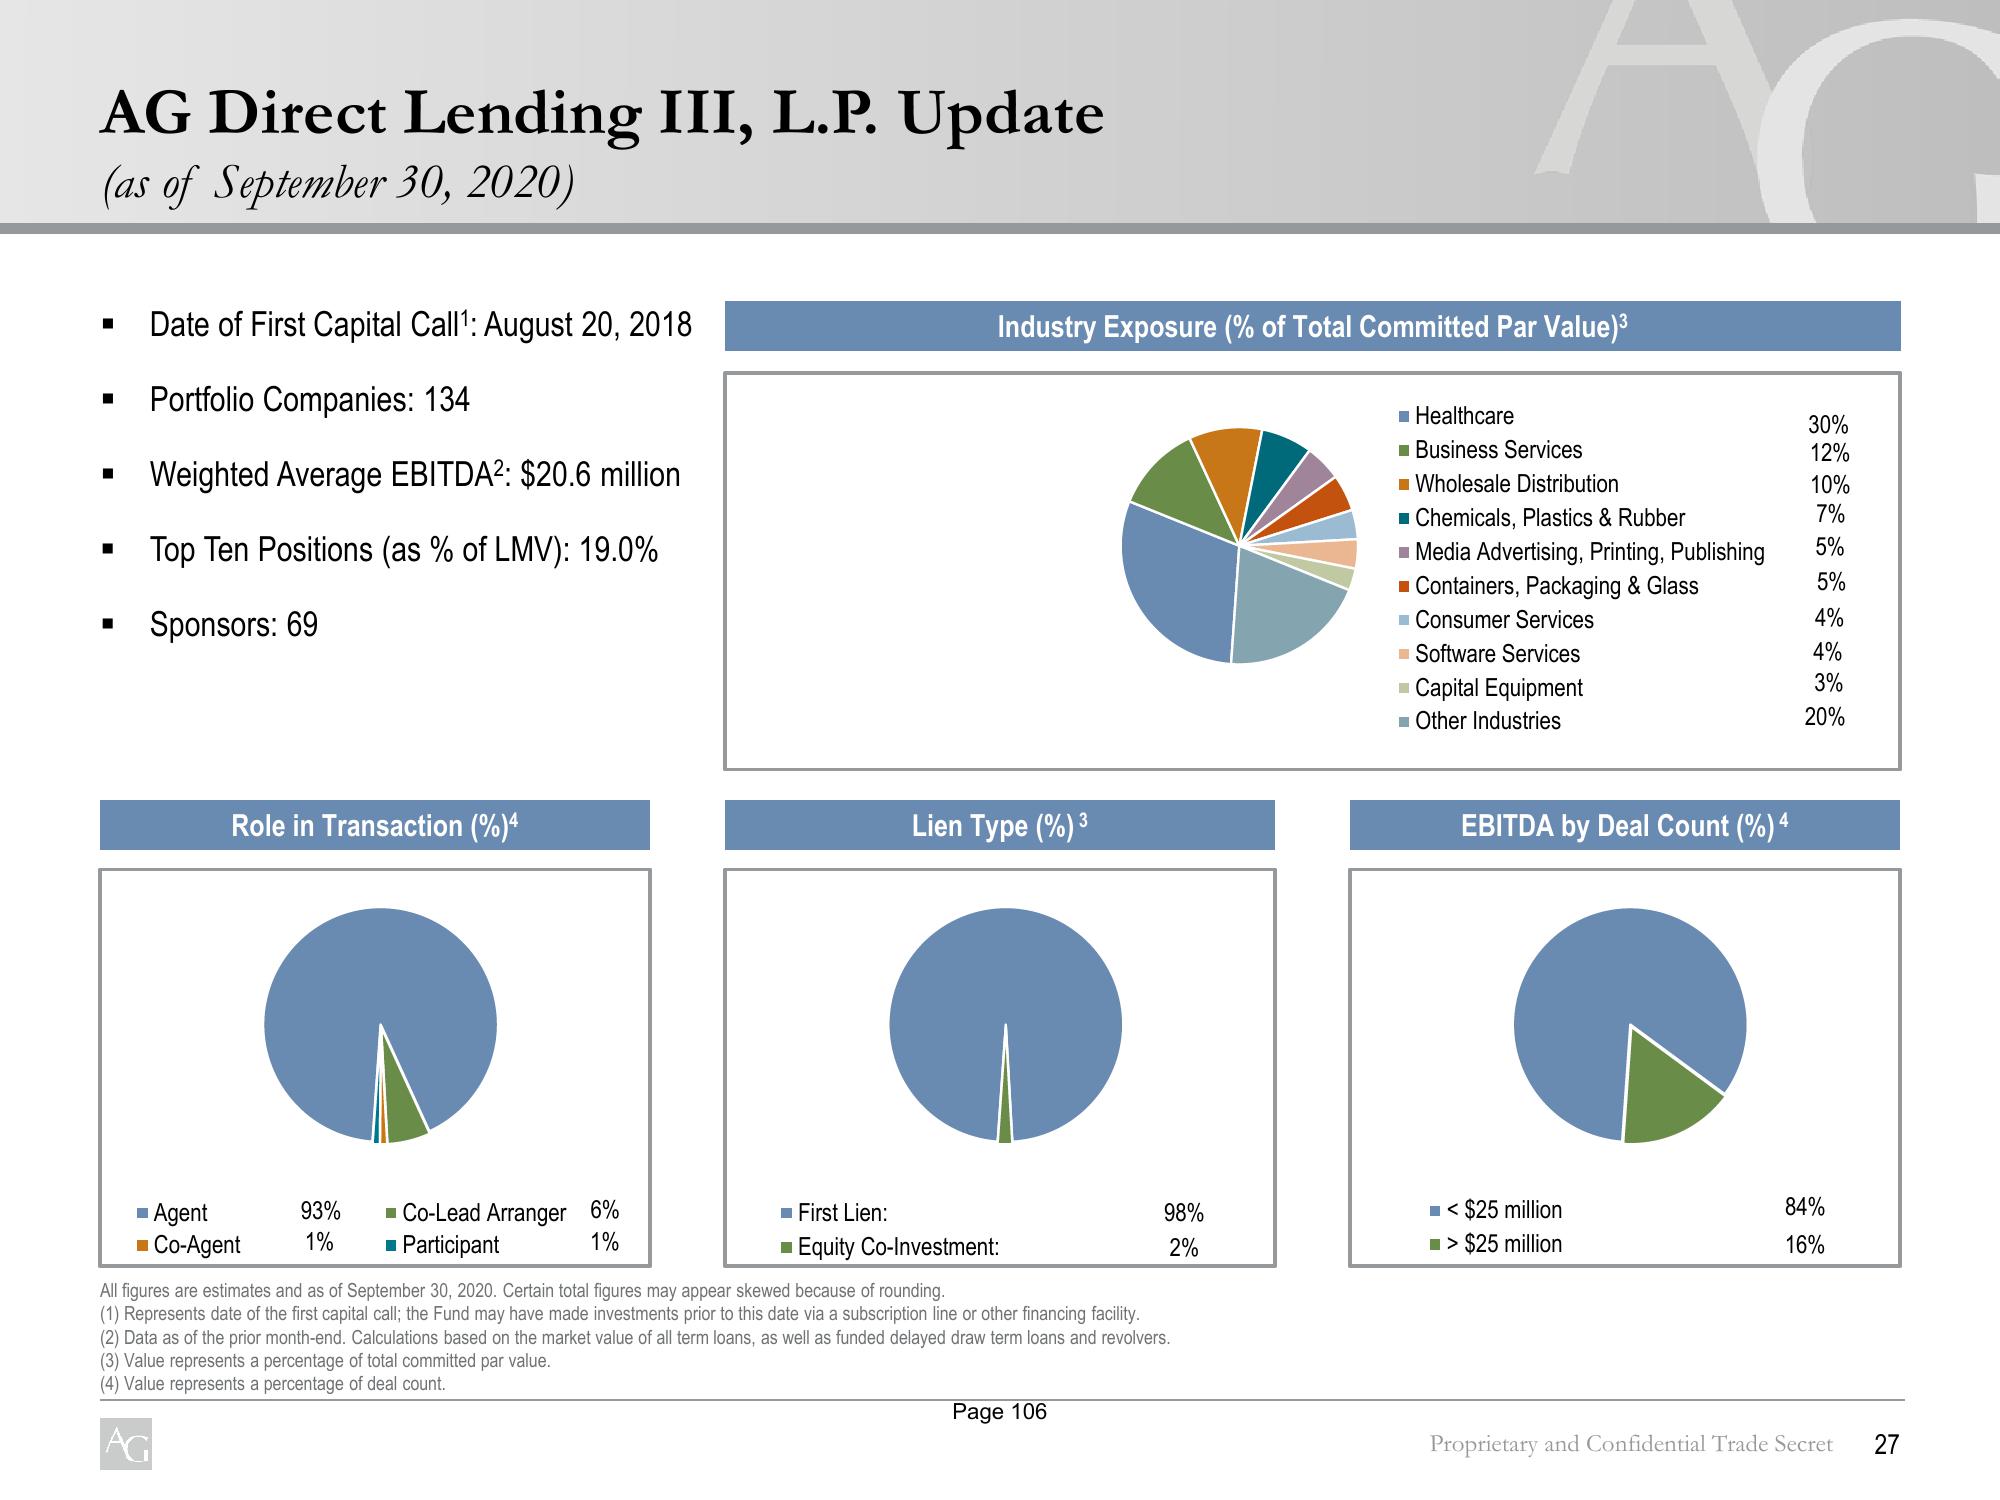
Date of First Capital Call¹: August 20, 2018
Portfolio Companies: 134
Weighted Average EBITDA²: $20.6 million
Top Ten Positions (as % of LMV): 19.0%
Sponsors: 69
Role in Transaction (%)4
■ Agent
■Co-Agent
93%
1%
Co-Lead Arranger 6%
■ Participant
1%
Industry Exposure (% of Total Committed Par Value)³
Lien Type (%) ³
■ First Lien:
■ Equity Co-Investment:
98%
2%
All figures are estimates and as of September 30, 2020. Certain total figures may appear skewed because of rounding.
(1) Represents date of the first capital call; the Fund may have made investments prior to this date via a subscription line or other financing facility.
(2) Data as of the prior month-end. Calculations based on the market value of all term loans, as well as funded delayed draw term loans and revolvers.
(3) Value represents a percentage of total committed par value.
(4) Value represents a percentage of deal count.
AG
Page 106
■Healthcare
■ Business Services
■ Wholesale Distribution
Chemicals, Plastics & Rubber
■ Media Advertising, Printing, Publishing
■ Containers, Packaging & Glass
Consumer Services
■ Software Services
Capital Equipment
■ Other Industries
EBITDA by Deal Count (%) 4
■< $25 million
■>$25 million
30%
12%
10%
7%
5%
5%
4%
4%
3%
20%
84%
16%
Proprietary and Confidential Trade Secret
27View entire presentation