Apollo Global Management Investor Presentation Deck
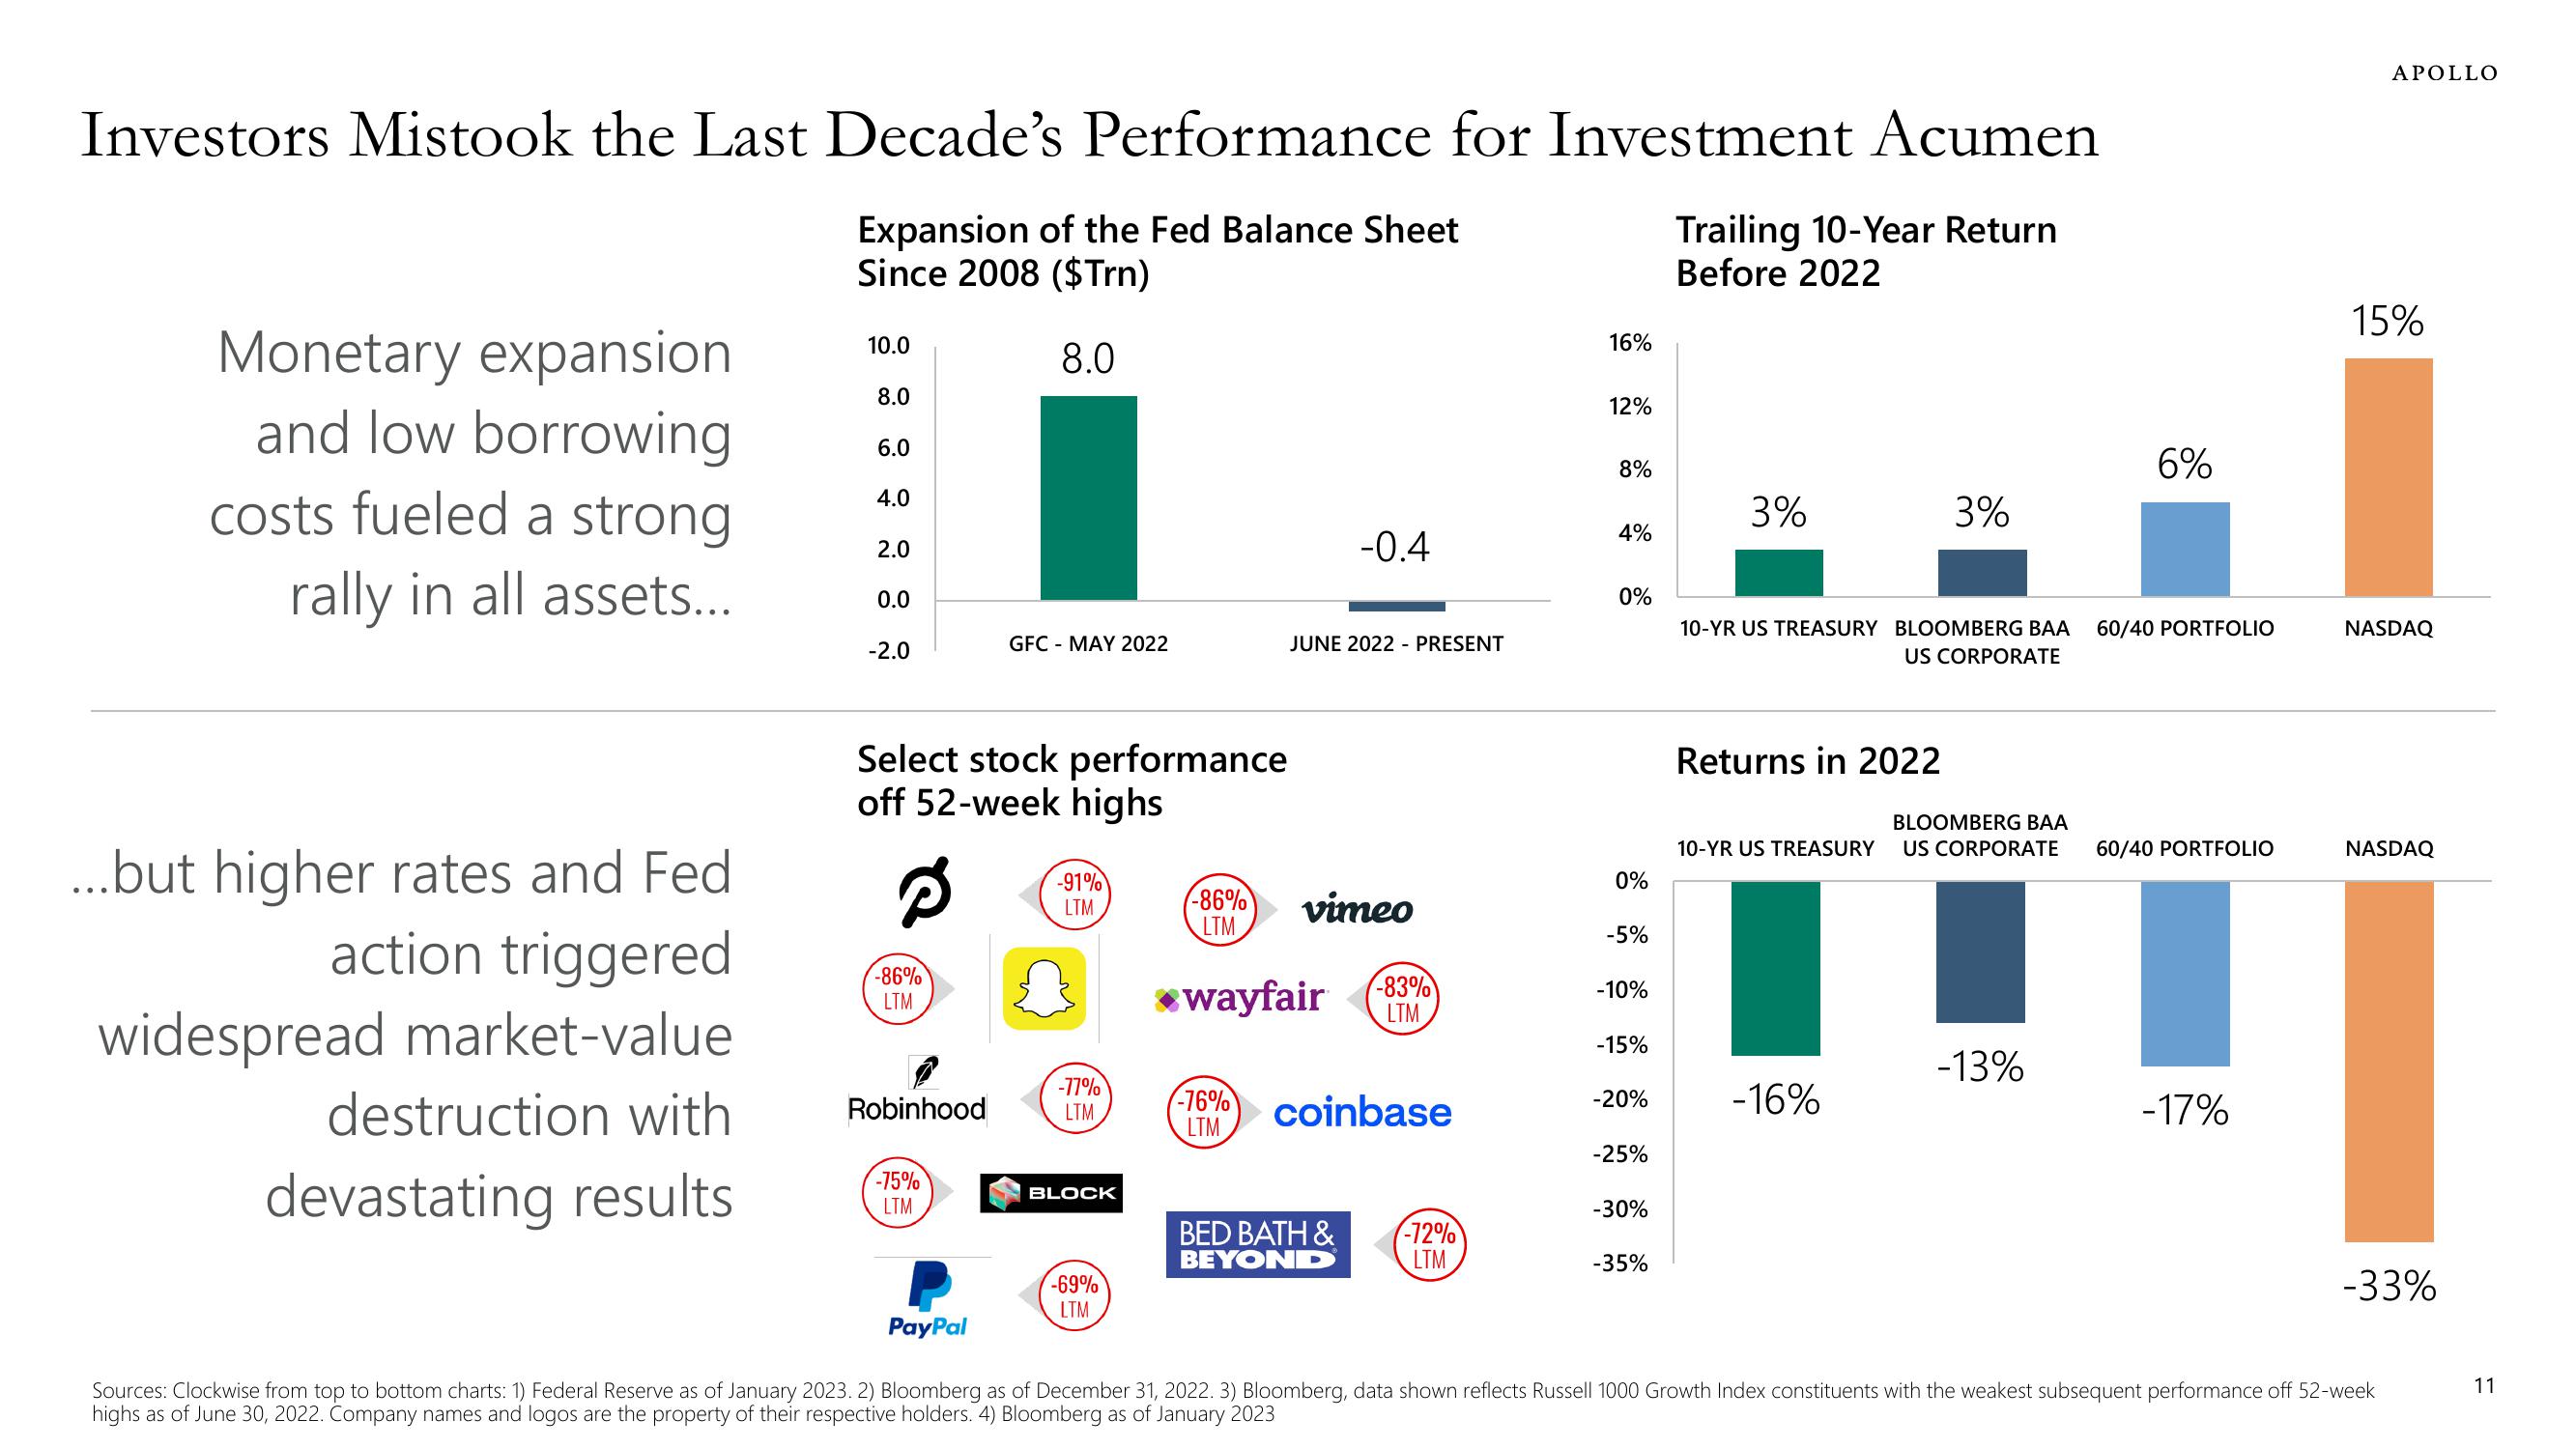
Investors Mistook the Last Decade's Performance for Investment Acumen
Expansion of the Fed Balance Sheet
Since 2008 ($Trn)
Trailing 10-Year Return
Before 2022
8.0
Monetary expansion
and low borrowing
costs fueled a strong
rally in all assets...
...but higher rates and Fed
action triggered
widespread market-value
destruction with
devastating results
10.0
8.0
6.0
4.0
2.0
0.0
-2.0
Select stock performance
off 52-week highs
8
-86%
LTM
Robinhood
-75%
LTM
GFC - MAY 2022
PayPal
-91%
LTM
-77%
LTM
BLOCK
-69%
LTM
-86%
LTM
*wayfair
-76%
LTM
JUNE 2022 - PRESENT
-0.4
vimeo
BED BATH &
BEYOND
-83%
LTM
coinbase
-72%
LTM
16%
12%
8%
4%
0%
0%
-5%
-10%
-15%
-20%
-25%
-30%
-35%
3%
10-YR US TREASURY BLOOMBERG BAA
US CORPORATE
Returns in 2022
3%
BLOOMBERG BAA
10-YR US TREASURY US CORPORATE
-16%
-13%
6%
60/40 PORTFOLIO
60/40 PORTFOLIO
-17%
APOLLO
15%
NASDAQ
NASDAQ
-33%
Sources: Clockwise from top to bottom charts: 1) Federal Reserve as of January 2023. 2) Bloomberg as of December 31, 2022. 3) Bloomberg, data shown reflects Russell 1000 Growth Index constituents with the weakest subsequent performance off 52-week
highs as of June 30, 2022. Company names and logos are the property of their respective holders. 4) Bloomberg as of January 2023
11View entire presentation