Sezzle Results Presentation Deck
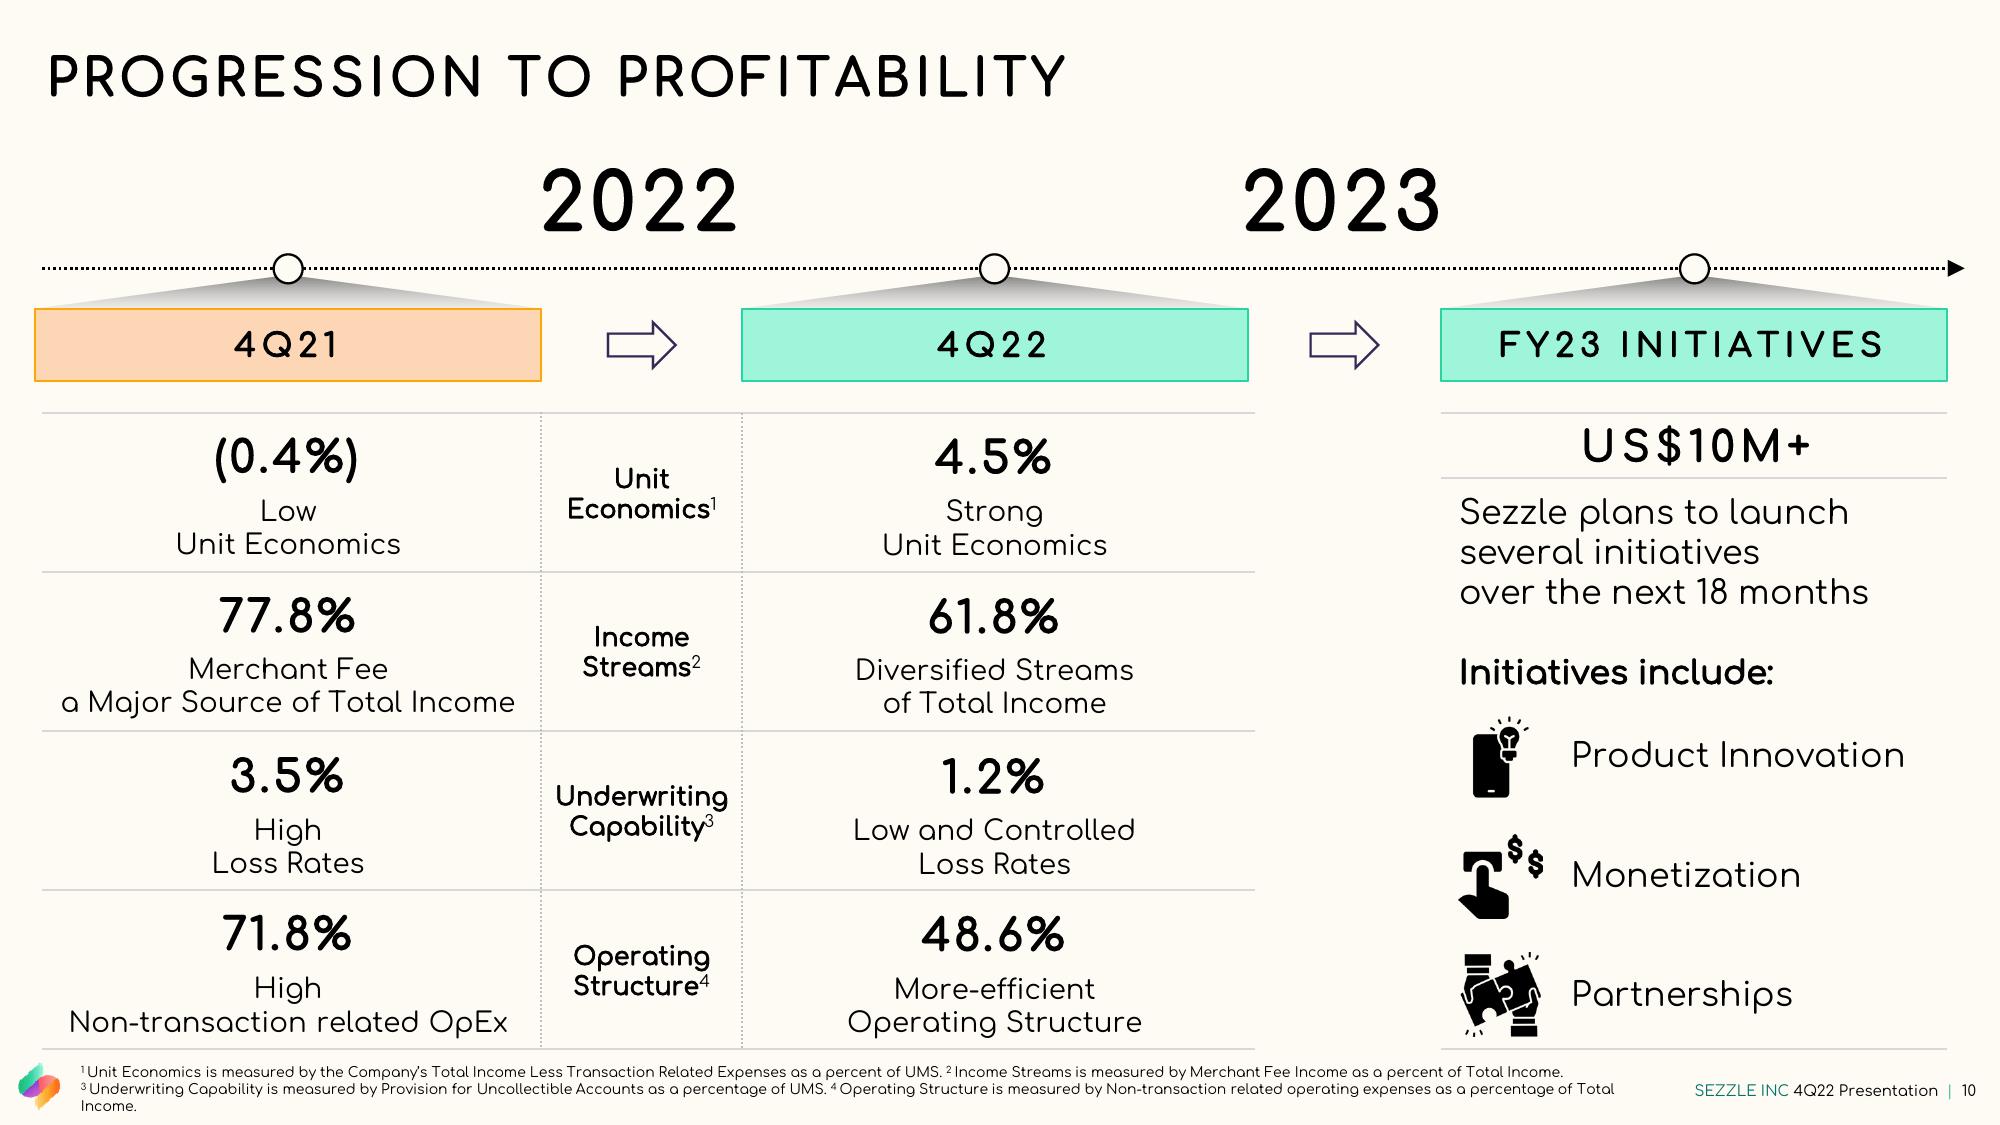
PROGRESSION TO PROFITABILITY
4Q21
(0.4%)
Low
Unit Economics
77.8%
Merchant Fee
a Major Source of Total Income
3.5%
High
Loss Rates
71.8%
High
2022
Unit
Economics¹
Income
Streams²
Underwriting
Capability³
Operating
Structure4
4Q22
4.5%
Strong
Unit Economics
61.8%
Diversified Streams
of Total Income
1.2%
Low and Controlled
Loss Rates
48.6%
More-efficient
2023
FY23 INITIATIVES
US$10M+
Sezzle plans to launch
several initiatives
over the next 18 months
Initiatives include:
ZIN
$$
Product Innovation
Monetization
Partnerships
Non-transaction related OpEx
Operating Structure
¹ Unit Economics is measured by the Company's Total Income Less Transaction Related Expenses as a percent of UMS. 2 Income Streams is measured by Merchant Fee Income as a percent of Total Income.
3 Underwriting Capability is measured by Provision for Uncollectible Accounts as a percentage of UMS. 4 Operating Structure is measured by Non-transaction related operating expenses as a percentage of Total
Income.
SEZZLE INC 4Q22 Presentation | 10View entire presentation