Bank of America Investment Banking Pitch Book
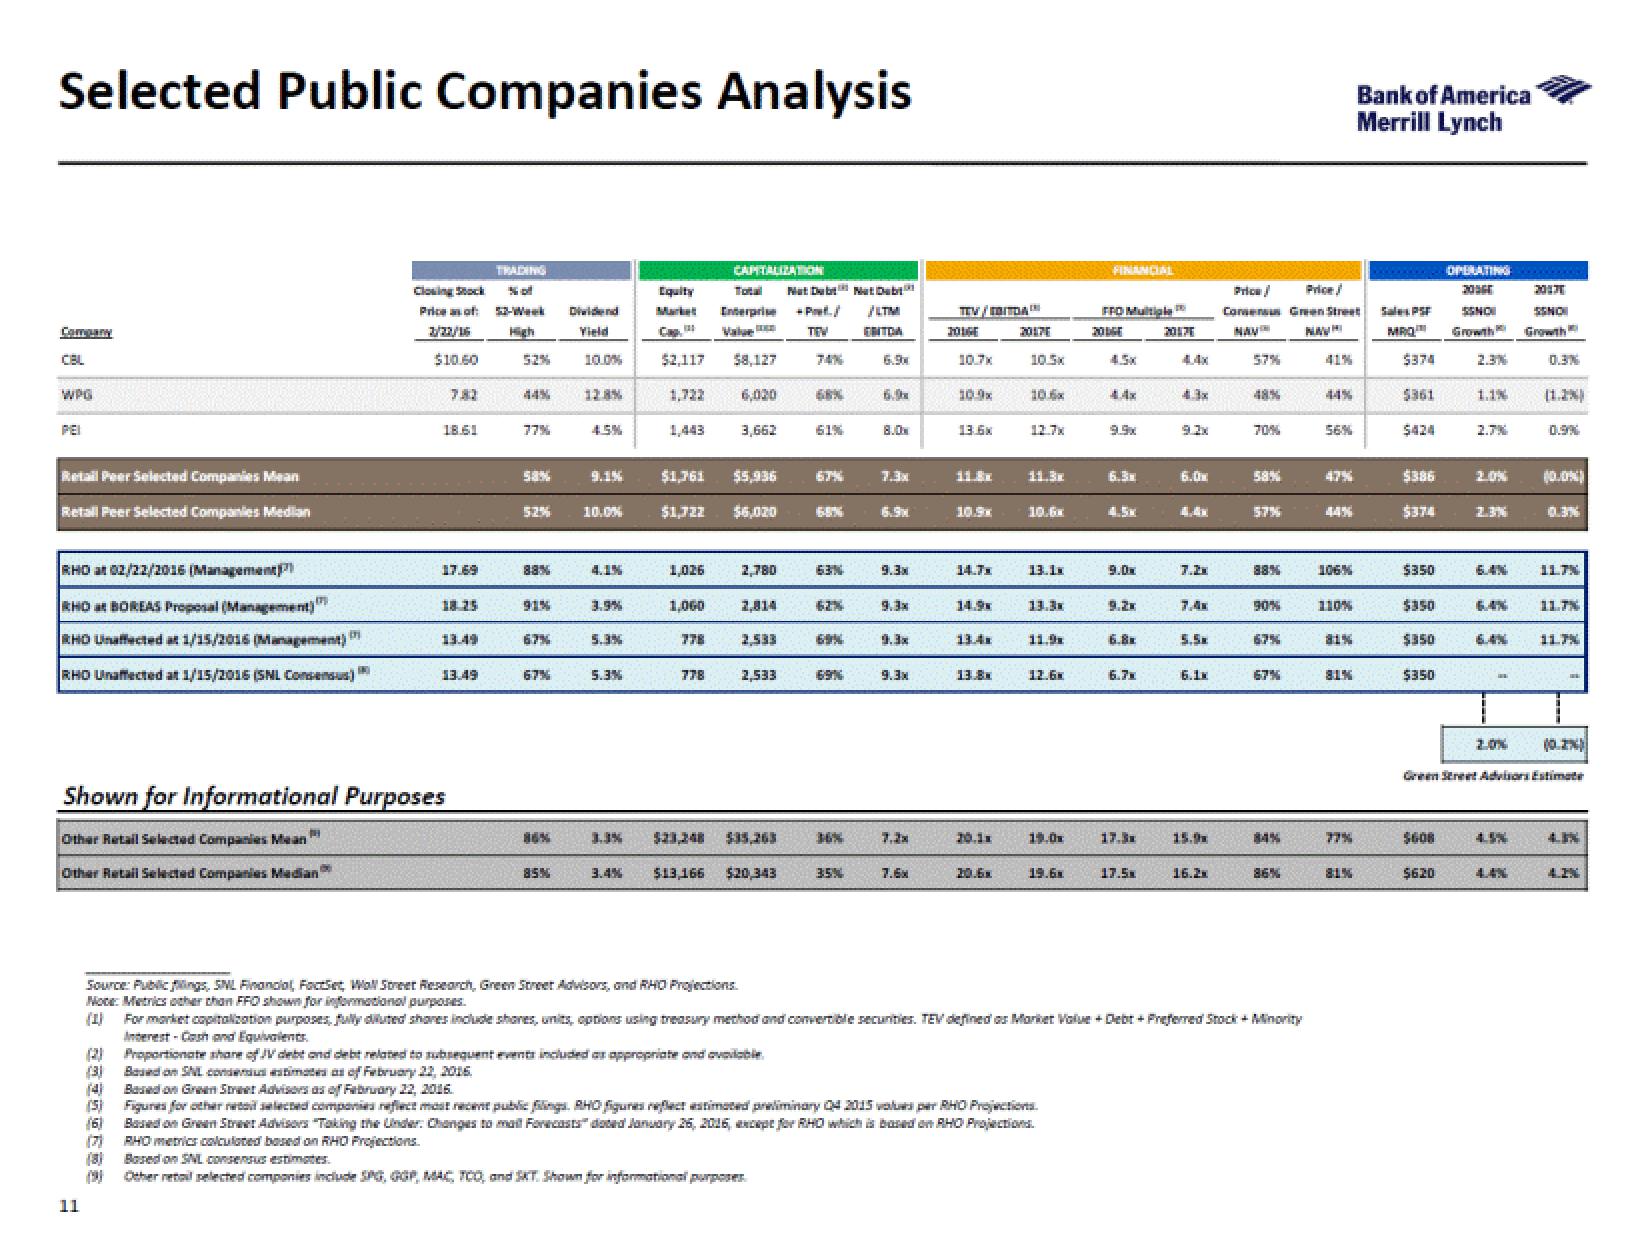
Selected Public Companies Analysis
Company
CBL
WPG
Retail Peer Selected Companies Mean
Retall Peer Selected Companies Median
RHD at 02/22/2016 (Management)
KHO at BOREAS Proposal (Management)
RHO Unaffected at 1/15/2016 (Management)
RHO Unaffected at 1/15/2016 (SNL Consensus)
11
Clowing Stock
Price of:
2/22/16
$10.60
3335002E
18.61
A
17.69
Shown for Informational Purposes
PH
Other Retail Selected Companies Mean
Other Retail Selected Companies Madian
18.25
13.49
TRADING
High
52%
44%
77%
53%
52%
88%
91%
67%
67%
85%
Dividend
Yield
10.0%
4.5%
9.1%
10.0%
19
3.9%
5.3%
5.3%
3.3%
3.4%
Equity
$2,117
1,443
1,026
1,060
778
CAPITALIZATION
Total Mat Dub
778
Enterprise
Value
$1,761
$5,936
$1,722 $6,020
58.127
6,020
3,662
2,780
2,814
Source: Public fings, SNL Financial, FactSet Wall Street Research, Green Street Advisors, and RHO Projections.
Note: Metrics other than FFO shown for informational purposes.
(1)
2,533
$23,248 $35,263
$13,166 $20,343
NatDab
+Prt./ /LTM
TIPW ERITOA
68%
(9) Other retail selected companies include SPG, GGP, MAC, TOO, and SKT. Shown for informational purposes.
61%
63%
67%
35%
6.9
8.0
7.3x
9.3x
9.3x
9.3x
7.3x
7.6x
TEV/DA
JOUGE
10.7x
10.9x
13.6x
11.8x
10.9x
14.7x
14.9
13.8x
20.1x
20.6x
20120
1Ox
10.6x
12.7x
11.3x
10.6x
13.1x
13.3M
11.9
12.6M
19.0x
19.6
(4) Based on Green Street Advisors as of February 22, 2016.
(5) Figures for other to selected companies reflect most recent public filings. RHO figures reflect estimated preliminary 04 2015 values per RHO Projections.
161 Based on Gream Street Advisors "Taking the Under: Changes to mail Forecasts dated January 26, 2016, except for RHO which is based on RHO Projections.
RHO metrics calculated based on RHO Projections.
Based on SNL consensus estimates.
FINANCIAL
FFO Multiple
2016
4.5x
4.4x
9.9x
6.3x
4.5K
9.0x
9.2x
6.8x
6.7x
17.3x
15
20171
6.0x
1.4.
7.2x
5.5x
6.1x
15.9
16.2x
Price/
Price/
Consensus Green Street
NAV
NAVI
57%
70%
58%
57%
90%
For market capitalization purposes, fully diluted shores include shares, units, oppions using treasury method and convertible securities. TEV defined as Market Value + Debt+ Preferred Stock + Minority
Interest-Cash and Equivalents
Proportionate share of JV debt and debt related to subsequent events included as appropriate and available
(3) Based on SNL consensus estimates as of February 22, 2016.
67%
84%
86%
44%
56%
106/%
110%
81%
SIN
77%
Bank of America
Merrill Lynch
81%
Sales PSF
MRO
$374
$361
$424
$386
$374
$350
$350
$350
$350
$608
OPERATING
$620
SSNOI
Growth
2.3%
1.1%
2.7%
2.0%
2.3%
6.4%
SINO
Growth
0.3%
0.9%
(0.0%)
11.7%
11.7%
Green Street Advisors Estimate
11.7%
LINView entire presentation