Trian Partners Activist Presentation Deck
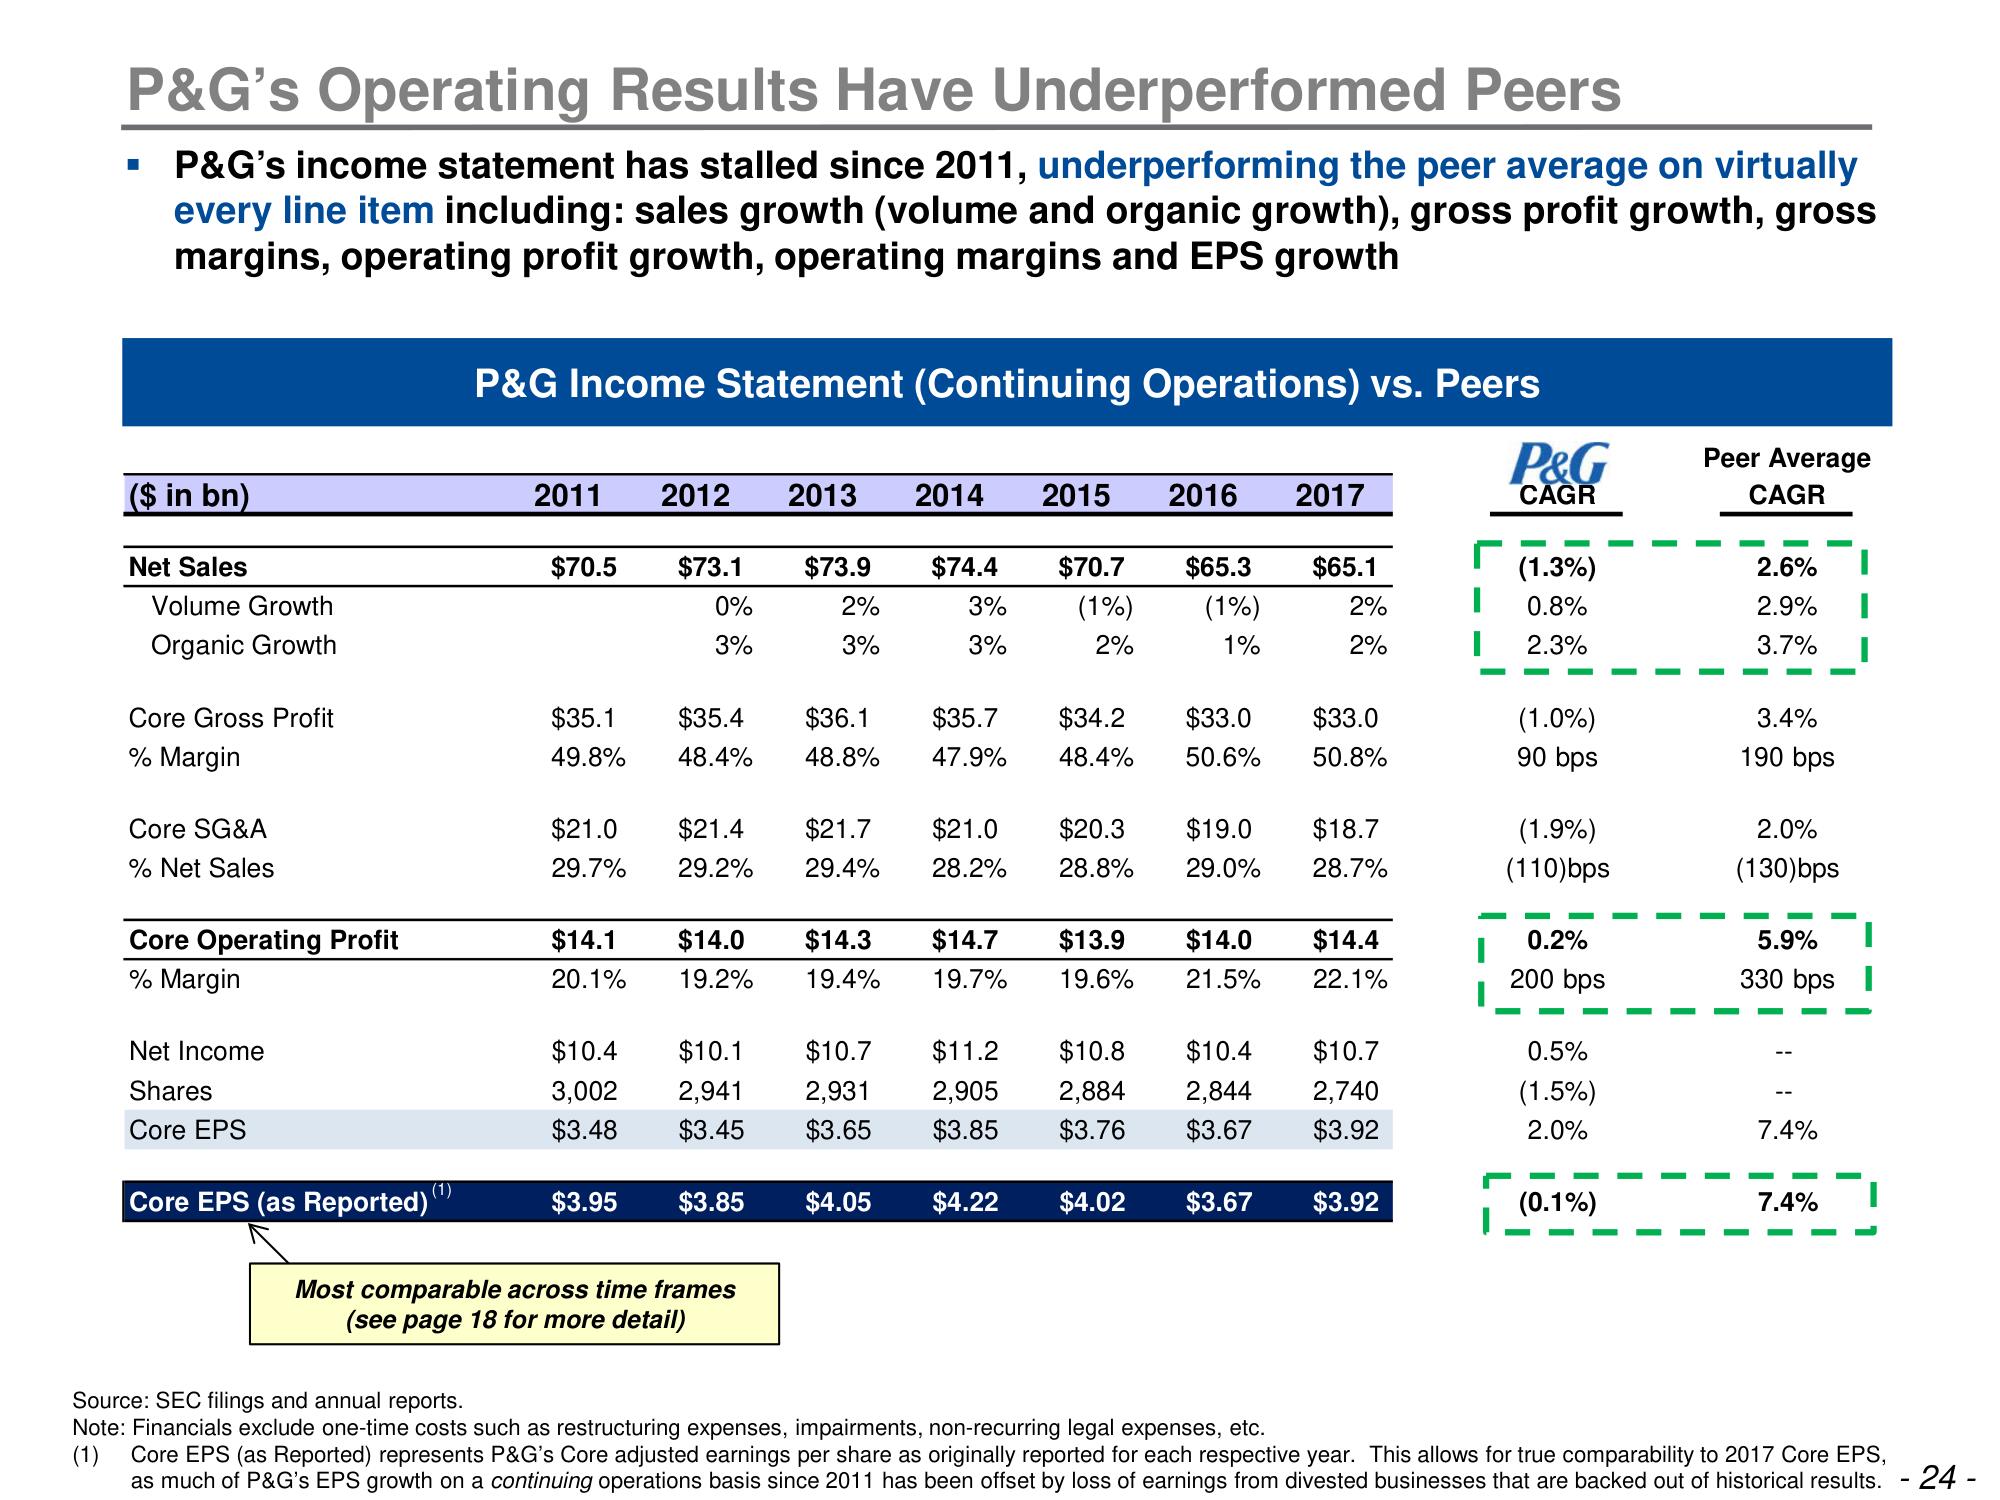
P&G's Operating Results Have Underperformed Peers
P&G's income statement has stalled since 2011, underperforming the peer average on virtually
every line item including: sales growth (volume and organic growth), gross profit growth, gross
margins, operating profit growth, operating margins and EPS growth
■
($ in bn)
Net Sales
Volume Growth
Organic Growth
Core Gross Profit
% Margin
Core SG&A
% Net Sales
Core Operating Profit
% Margin
Net Income
Shares
Core EPS
Core EPS (as Reported)
(1)
P&G Income Statement (Continuing Operations) vs. Peers
P&G
CAGR
2011 2012 2013 2014
$70.5 $73.1
0%
3%
$35.1
49.8%
$21.0
29.7%
$14.1
20.1%
$35.4
48.4%
$3.95
$21.4
29.2%
$73.9
2%
3%
$3.85
Most comparable across time frames
(see page 18 for more detail)
$74.4
3%
3%
$36.1 $35.7
48.8% 47.9%
$21.7 $21.0
29.4% 28.2%
2015 2016 2017
$70.7 $65.3 $65.1
(1%) (1%)
2%
1%
$14.0 $14.3 $14.7 $13.9
19.2% 19.4% 19.7%
19.6%
$4.05
$34.2 $33.0
48.4% 50.6%
2%
2%
$10.4 $10.1 $10.7 $11.2 $10.8 $10.4 $10.7
3,002 2,941 2,931 2,905 2,884 2,844 2,740
$3.48 $3.45 $3.65 $3.85 $3.76 $3.67 $3.92
$33.0
50.8%
$20.3 $19.0 $18.7
28.8% 29.0% 28.7%
$14.0 $14.4
21.5% 22.1%
$4.22 $4.02 $3.67 $3.92
I
(1.3%)
0.8%
2.3%
(1.0%)
90 bps
(1.9%)
(110)bps
0.2%
200 bps
0.5%
(1.5%)
2.0%
(0.1%)
Peer Average
CAGR
2.6%
2.9%
3.7%
3.4%
190 bps
2.0%
(130)bps
5.9%
330 bpsI
7.4%
7.4%
Source: SEC filings and annual reports.
Note: Financials exclude one-time costs such as restructuring expenses, impairments, non-recurring legal expenses, etc.
(1) Core EPS (as Reported) represents P&G's Core adjusted earnings per share as originally reported for each respective year. This allows for true comparability to 2017 Core EPS,
as much of P&G's EPS growth on a continuing operations basis since 2011 has been offset by loss of earnings from divested businesses that are backed out of historical results.
- 24 -View entire presentation