3Q20 Earnings Call Presentation
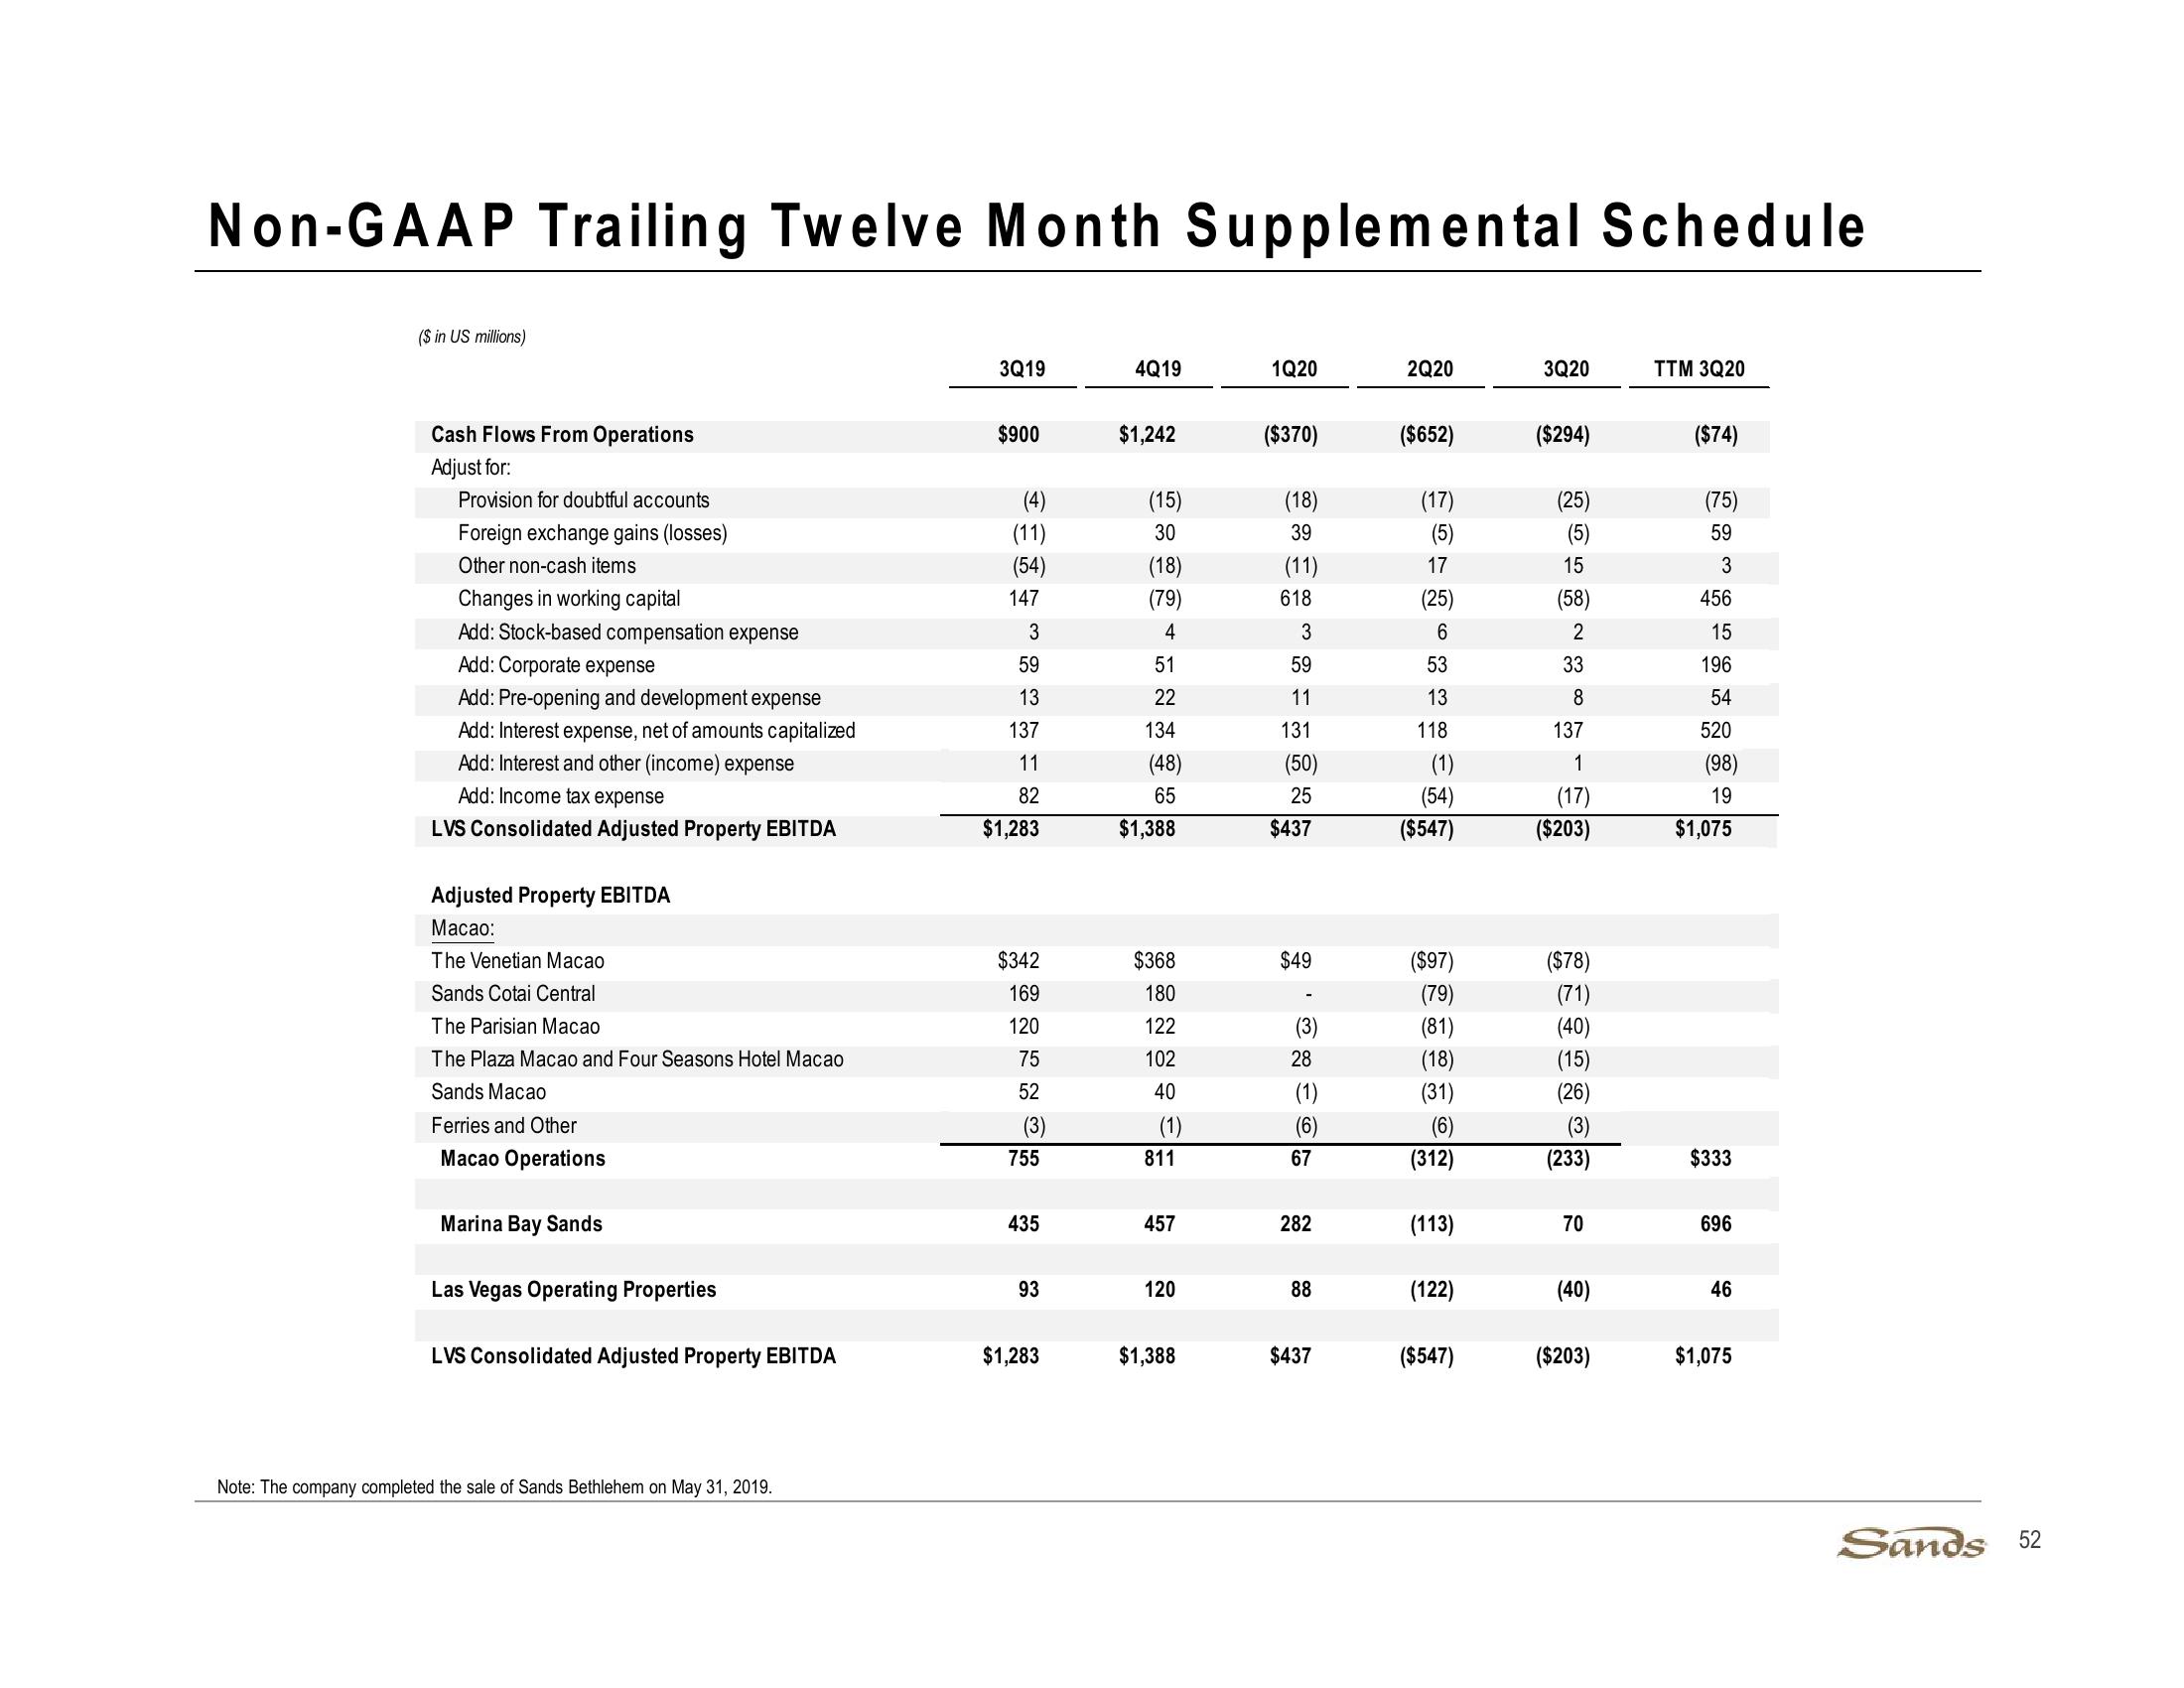
Non-GAAP Trailing Twelve Month Supplemental Schedule
($ in US millions)
3Q19
4Q19
1Q20
2Q20
3Q20
TTM 3Q20
Cash Flows From Operations
$900
$1,242
($370)
($652)
($294)
($74)
Adjust for:
Provision for doubtful accounts
(4)
Foreign exchange gains (losses)
(11)
Other non-cash items
(54)
Changes in working capital
147
Add: Stock-based compensation expense
3
Add: Corporate expense
59
Add: Pre-opening and development expense
13
Add: Interest expense, net of amounts capitalized
137
134
Add: Interest and other (income) expense
Add: Income tax expense
11
82
222222
(15)
(18)
39
(18)
(11)
(79)
618
(25)
3
59
11
131
118
(48)
(50)
ཞྲི་ཆེ༠ ༠8བབྱེ
(17)
(25)
(75)
(5)
(5)
59
15
3
(58)
456
2
15
33
196
8
54
137
520
(1)
1
(98)
25
(54)
(17)
19
LVS Consolidated Adjusted Property EBITDA
$1,283
$1,388
$437
($547)
($203)
$1,075
Adjusted Property EBITDA
Macao:
The Venetian Macao
$342
Sands Cotai Central
169
The Parisian Macao
120
The Plaza Macao and Four Seasons Hotel Macao
75
Sands Macao
52
Ferries and Other
(3)
Macao Operations
755
Marina Bay Sands
($97)
($78)
(79)
(71)
(81)
(40)
(18)
(15)
(31)
(26)
(6)
(312)
(233)
$333
435
457
282
(113)
70
696
Las Vegas Operating Properties
93
120
88
(122)
(40)
46
LVS Consolidated Adjusted Property EBITDA
$1,283
$1,388
$437
($547)
($203)
$1,075
$368
$49
180
122
102
40
(1)
811
ཐགྱེཌཱུ8ཝེ, ཙྪི
Note: The company completed the sale of Sands Bethlehem on May 31, 2019.
Sands 52View entire presentation