MP Materials Results Presentation Deck
Financial Metrics
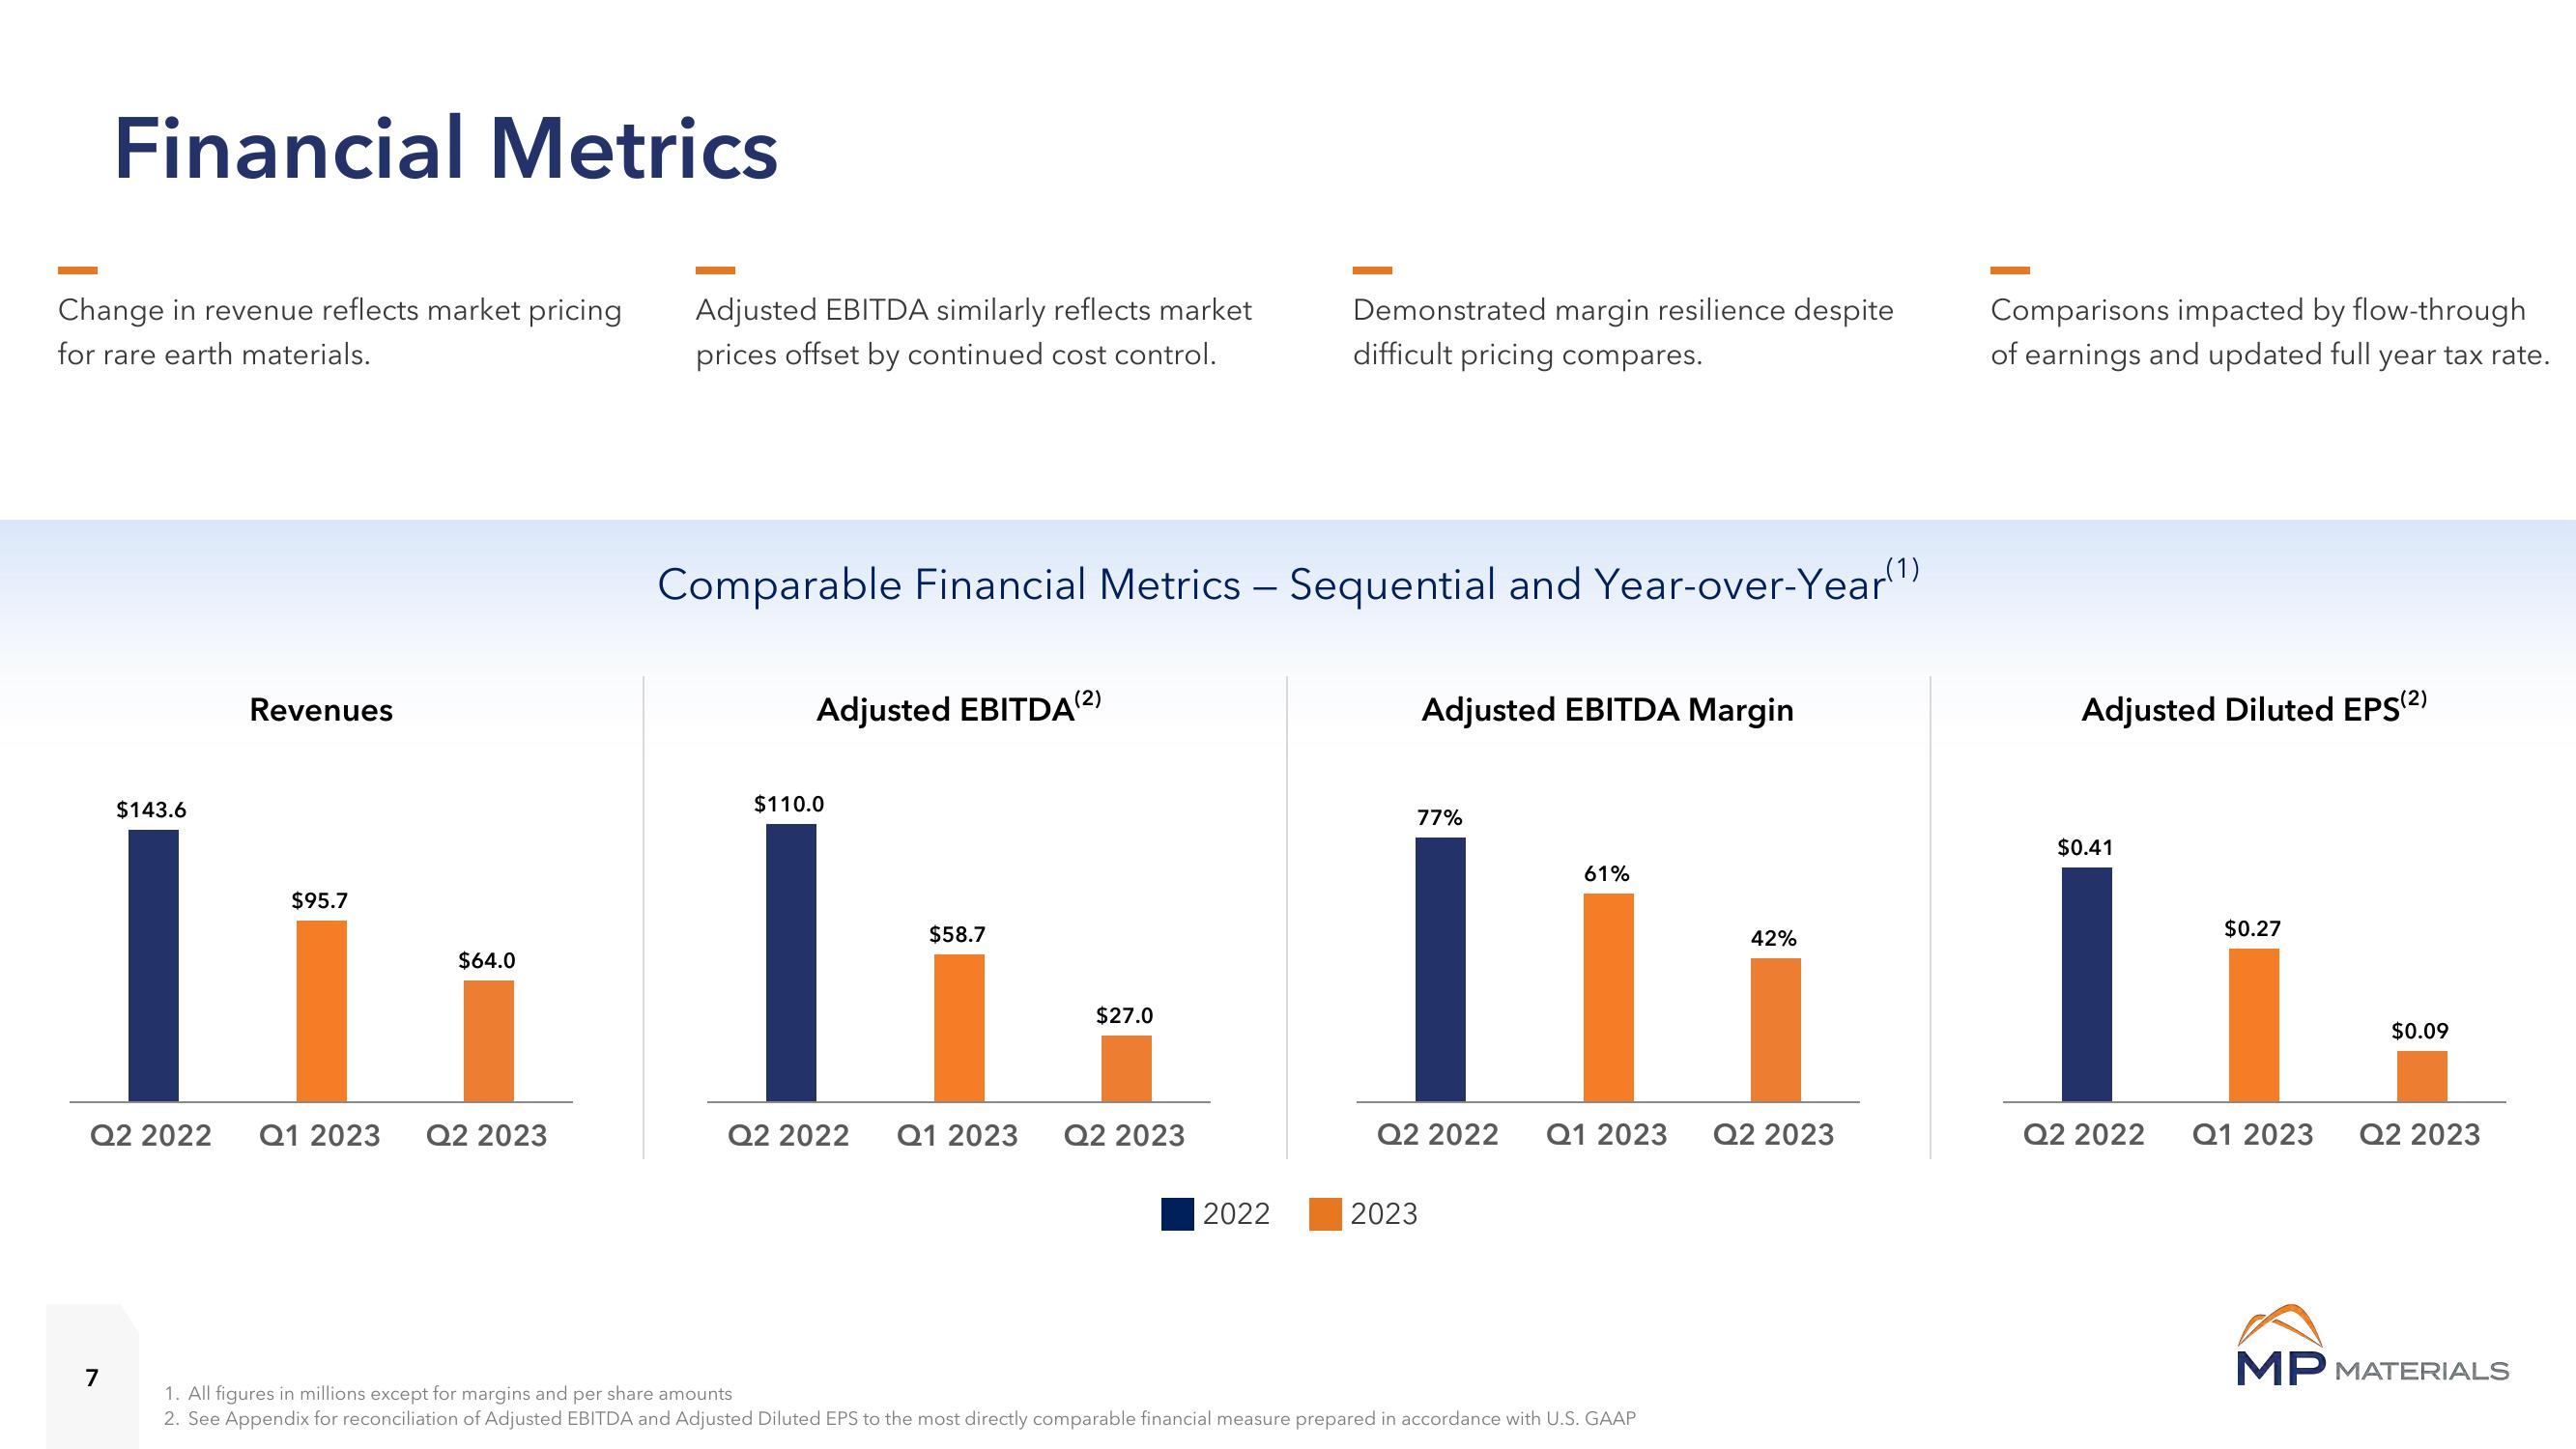
Change in revenue reflects market pricing
for rare earth materials.
7
$143.6
Revenues
$95.7
$64.0
Q2 2022 Q1 2023 Q2 2023
Adjusted EBITDA similarly reflects market
prices offset by continued cost control.
Comparable Financial Metrics - Sequential and Year-over-Year(¹)
Adjusted EBITDA (²)
$110.0
$58.7
$27.0
Q2 2022 Q1 2023 Q2 2023
Demonstrated margin resilience despite
difficult pricing compares.
2022
Adjusted EBITDA Margin
77%
2023
61%
Q2 2022 Q1 2023
1. All figures in millions except for margins and per share amounts
2. See Appendix for reconciliation of Adjusted EBITDA and Adjusted Diluted EPS to the most directly comparable financial measure prepared in accordance with U.S. GAAP
42%
Q2 2023
Comparisons impacted by flow-through
of earnings and updated full year tax rate.
Adjusted Diluted EPS(2)
$0.41
Q2 2022
$0.27
Q1 2023
$0.09
Q2 2023
MP MATERIALSView entire presentation