PowerSchool Results Presentation Deck
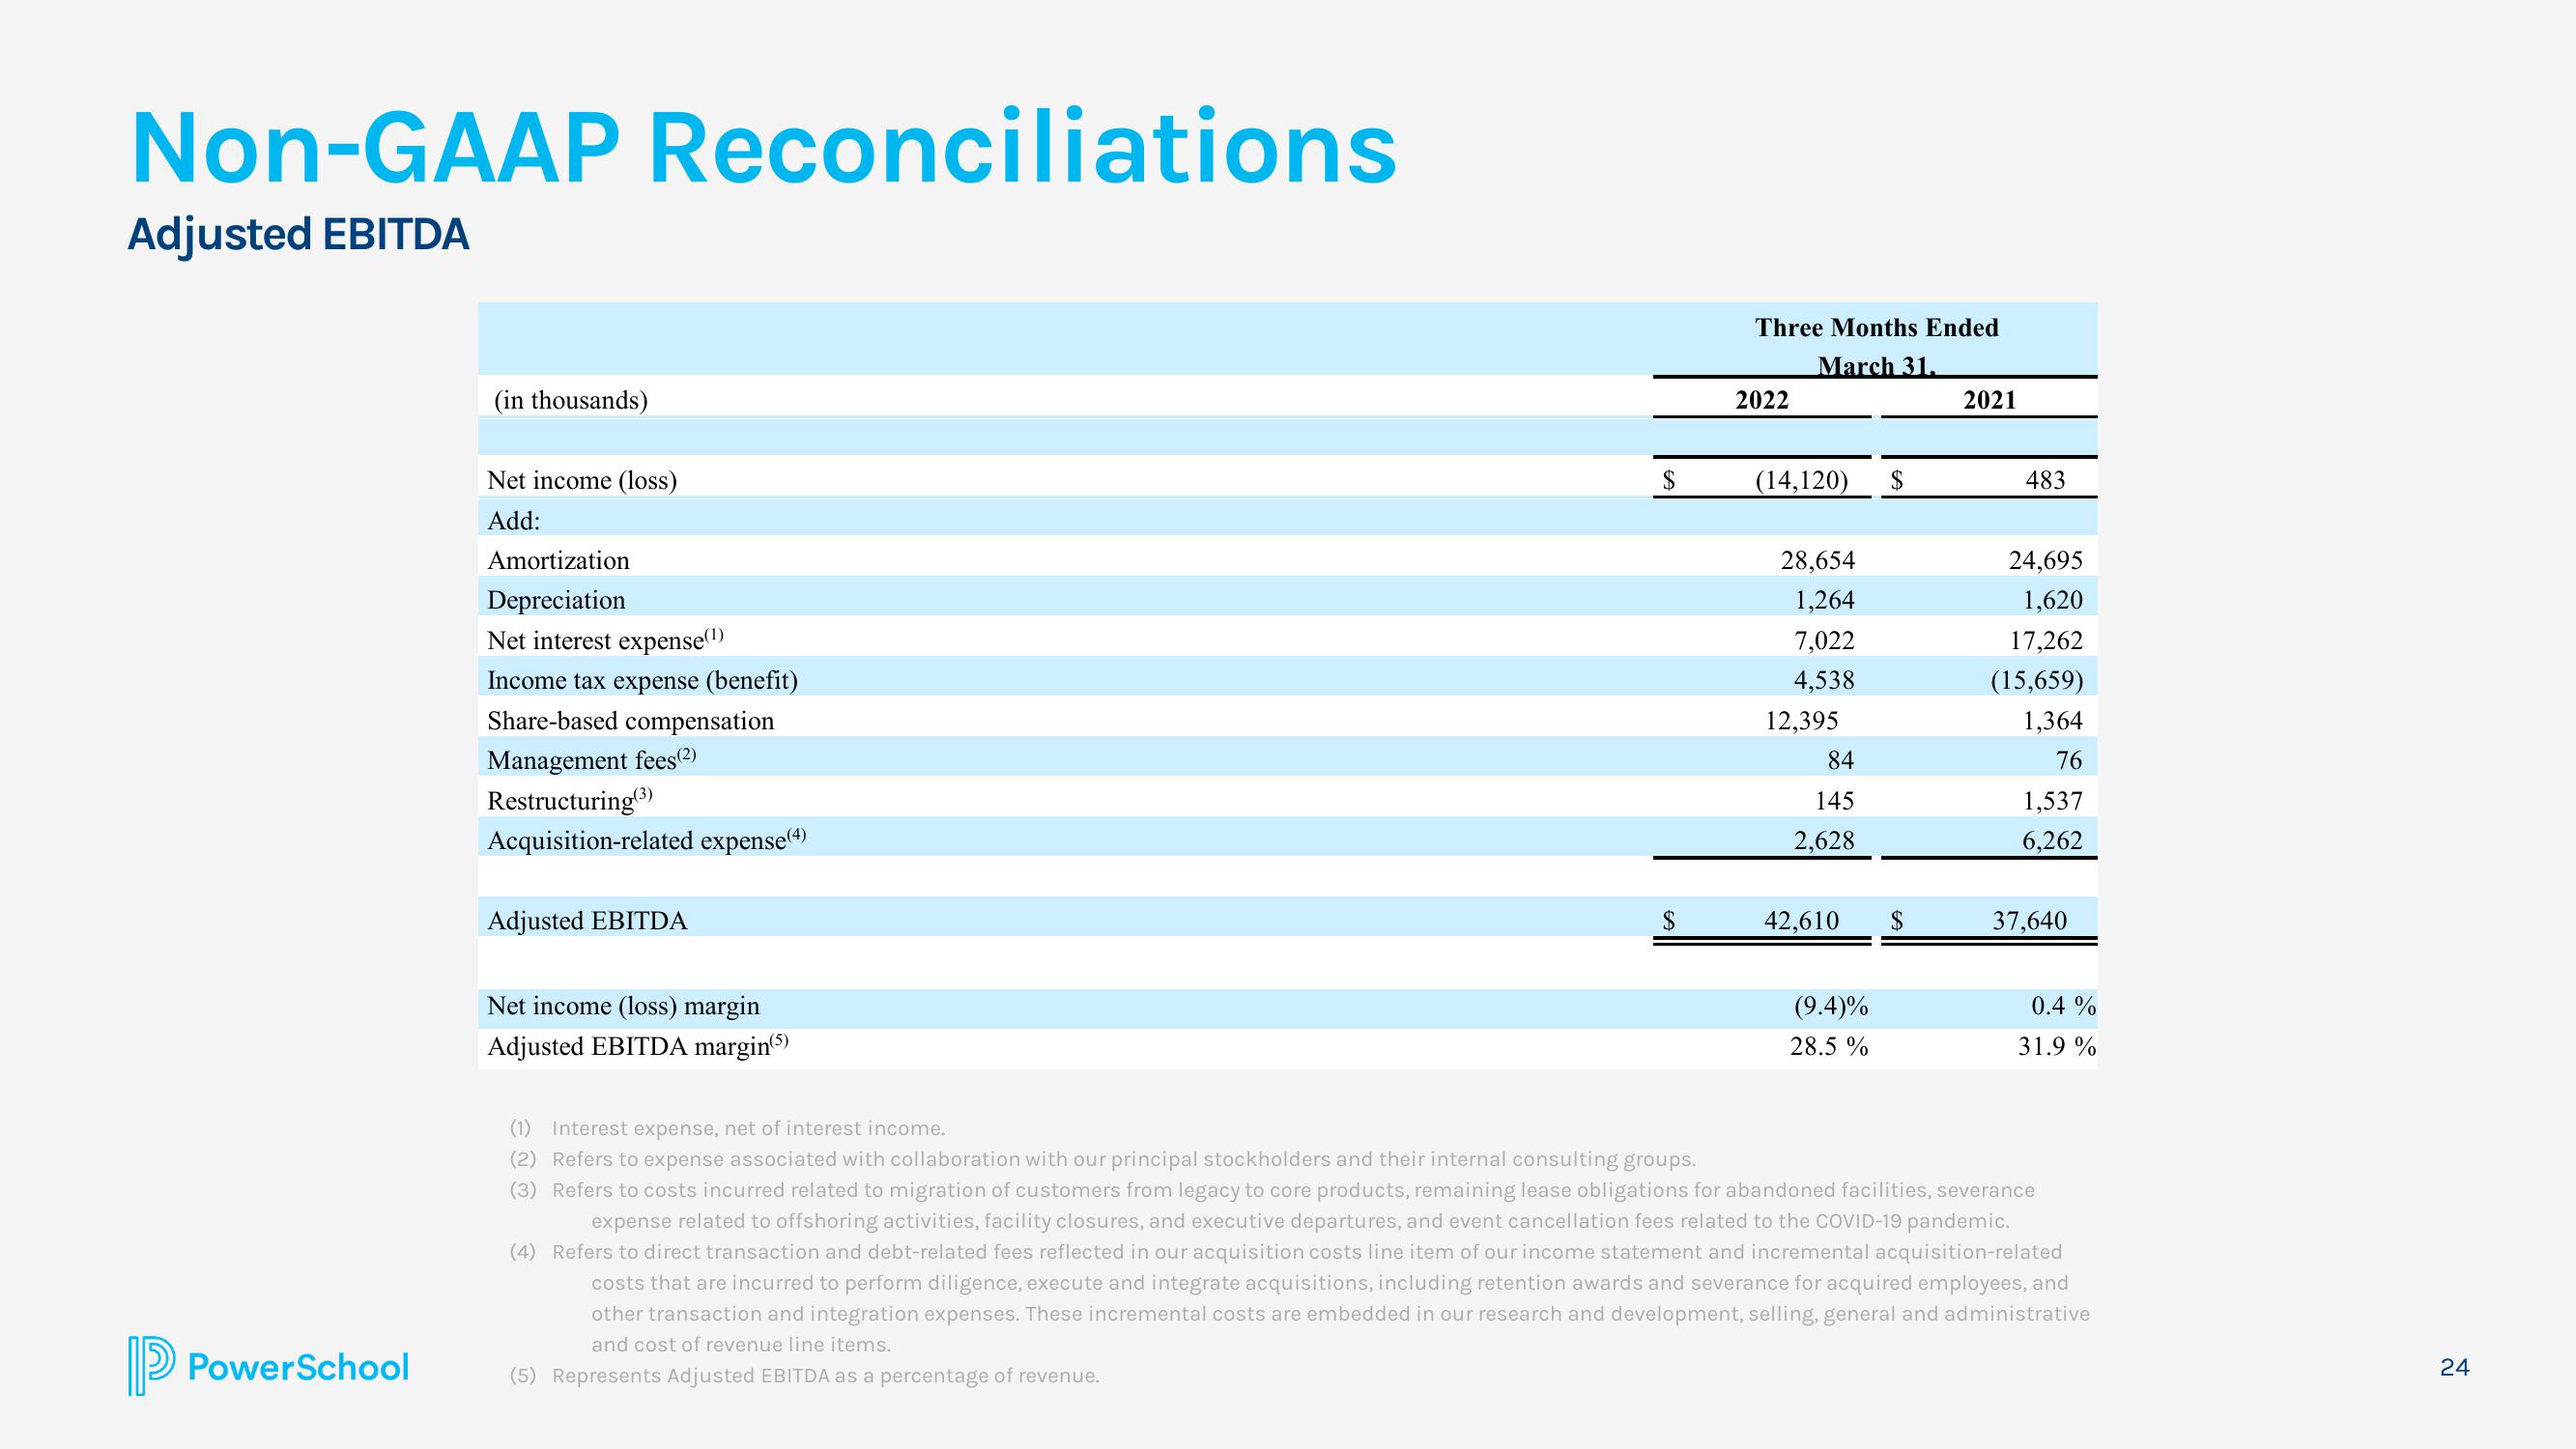
Non-GAAP Reconciliations
Adjusted EBITDA
PowerSchool
(in thousands)
Net income (loss)
Add:
Amortization
Depreciation
Net interest expense(¹)
Income tax expense (benefit)
Share-based compensation
Management fees(2)
Restructuring (3)
Acquisition-related expense(4)
Adjusted EBITDA
Net income (loss) margin
Adjusted EBITDA margin(5)
$
$
Three Months Ended
March 31.
2022
(14,120)
28,654
1,264
7,022
4,538
12,395
84
145
2,628
42,610
(9.4)%
28.5%
$
$
2021
483
24,695
1,620
17,262
(15,659)
1,364
76
1,537
6,262
37,640
0.4%
31.9 %
(1) Interest expense, net of interest income.
(2) Refers to expense associated with collaboration with our principal stockholders and their internal consulting groups.
(3) Refers to costs incurred related to migration of customers from legacy to core products, remaining lease obligations for abandoned facilities, severance
expense related to offshoring activities, facility closures, and executive departures, and event cancellation fees related to the COVID-19 pandemic.
(4) Refers to direct transaction and debt-related fees reflected in our acquisition costs line item of our income statement and incremental acquisition-related
costs that are incurred to perform diligence, execute and integrate acquisitions, including retention awards and severance for acquired employees, and
other transaction and integration expenses. These incremental costs are embedded in our research and development, selling, general and administrative
and cost of revenue line items.
(5) Represents Adjusted EBITDA as a percentage of revenue.
24View entire presentation