Experian Investor Presentation Deck
Financial highlights
20
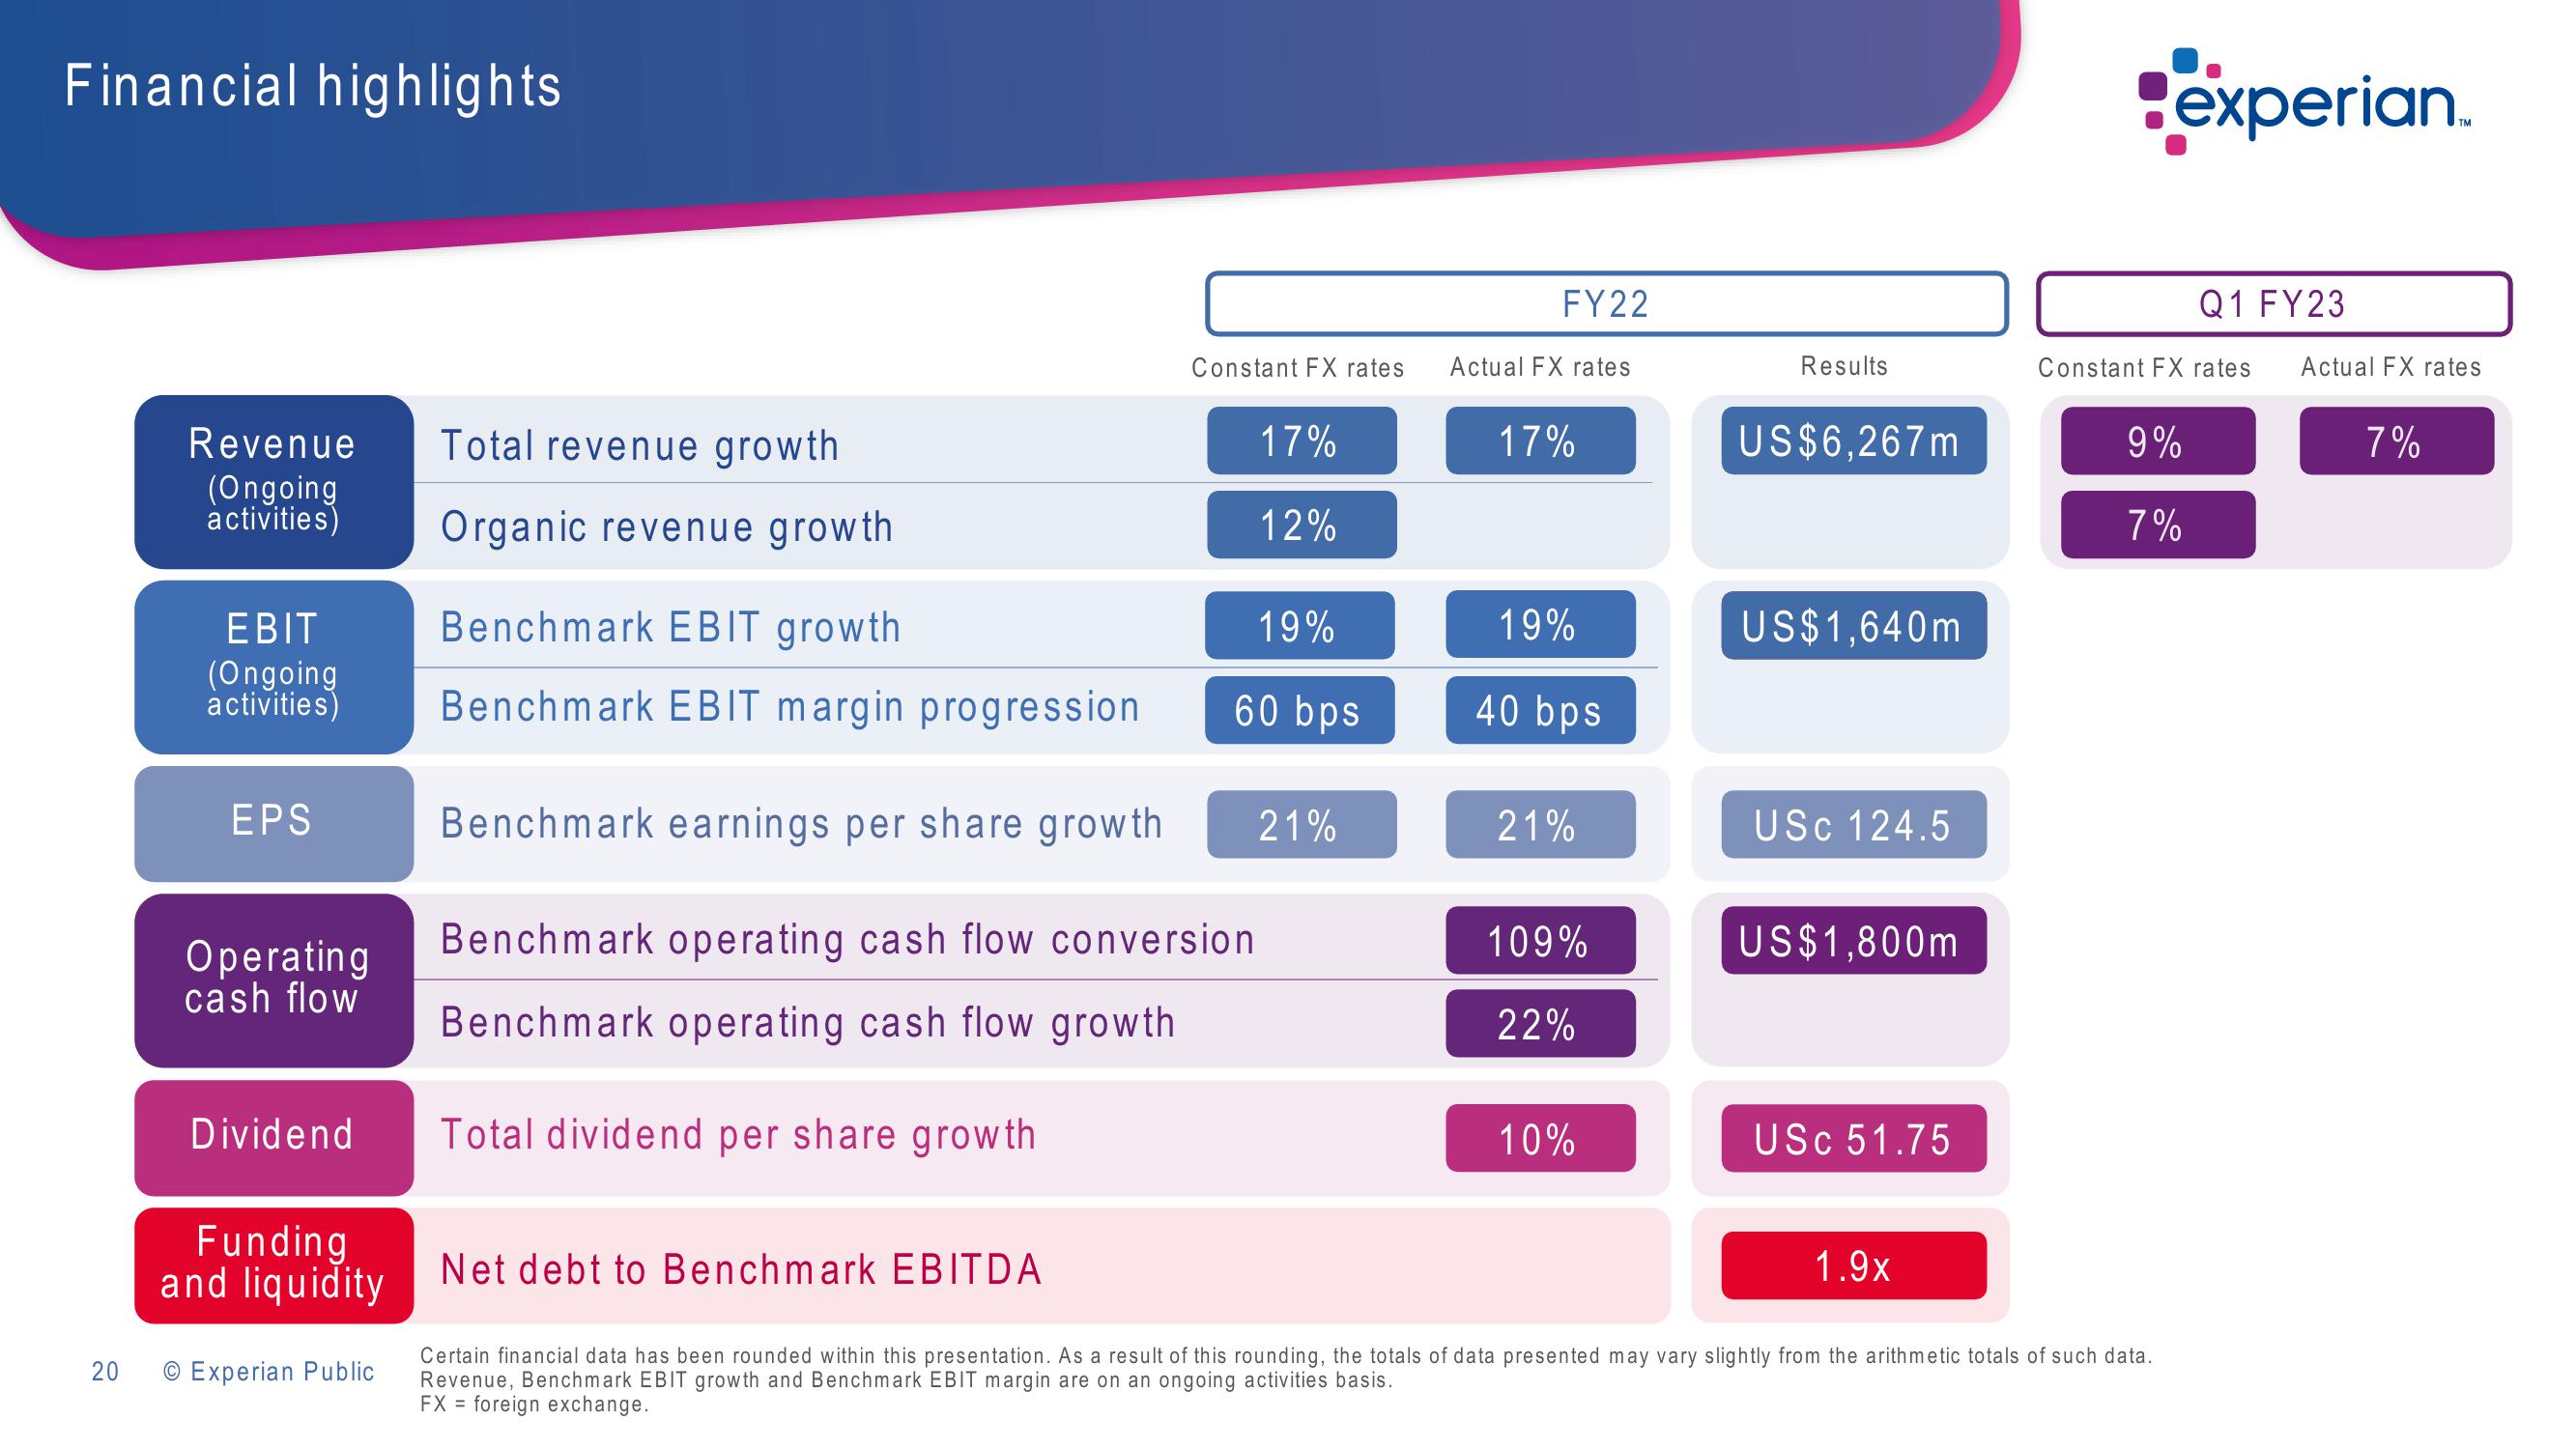
Revenue Total revenue growth
(Ongoing
activities)
Organic revenue growth
EBIT
(Ongoing
activities)
EPS
Operating
cash flow
Dividend
Funding
and liquidity
Experian Public
Benchmark EBIT growth
Benchmark EBIT margin progression
FY22
Constant FX rates Actual FX rates
17%
12%
Net debt to Benchmark EBITDA
19%
60 bps
Benchmark earnings per share growth 21%
Benchmark operating cash flow conversion
Benchmark operating cash flow growth
Total dividend per share growth
17%
19%
40 bps
21%
109%
22%
10%
Results
US$6,267m
US$ 1,640m
USC 124.5
US$1,800m
USC 51.75
1.9x
I
Certain financial data has been rounded within this presentation. As a result of this rounding, the totals of data presented may vary slightly from the arithmetic totals of such data.
Revenue, Benchmark EBIT growth and Benchmark EBIT margin are on an ongoing activities basis.
FX foreign exchange.
experian.
Q1 FY23
Constant FX rates Actual FX rates
9%
7%
7%View entire presentation