J.P.Morgan Results Presentation Deck
JPMORGAN CHASE & CO.
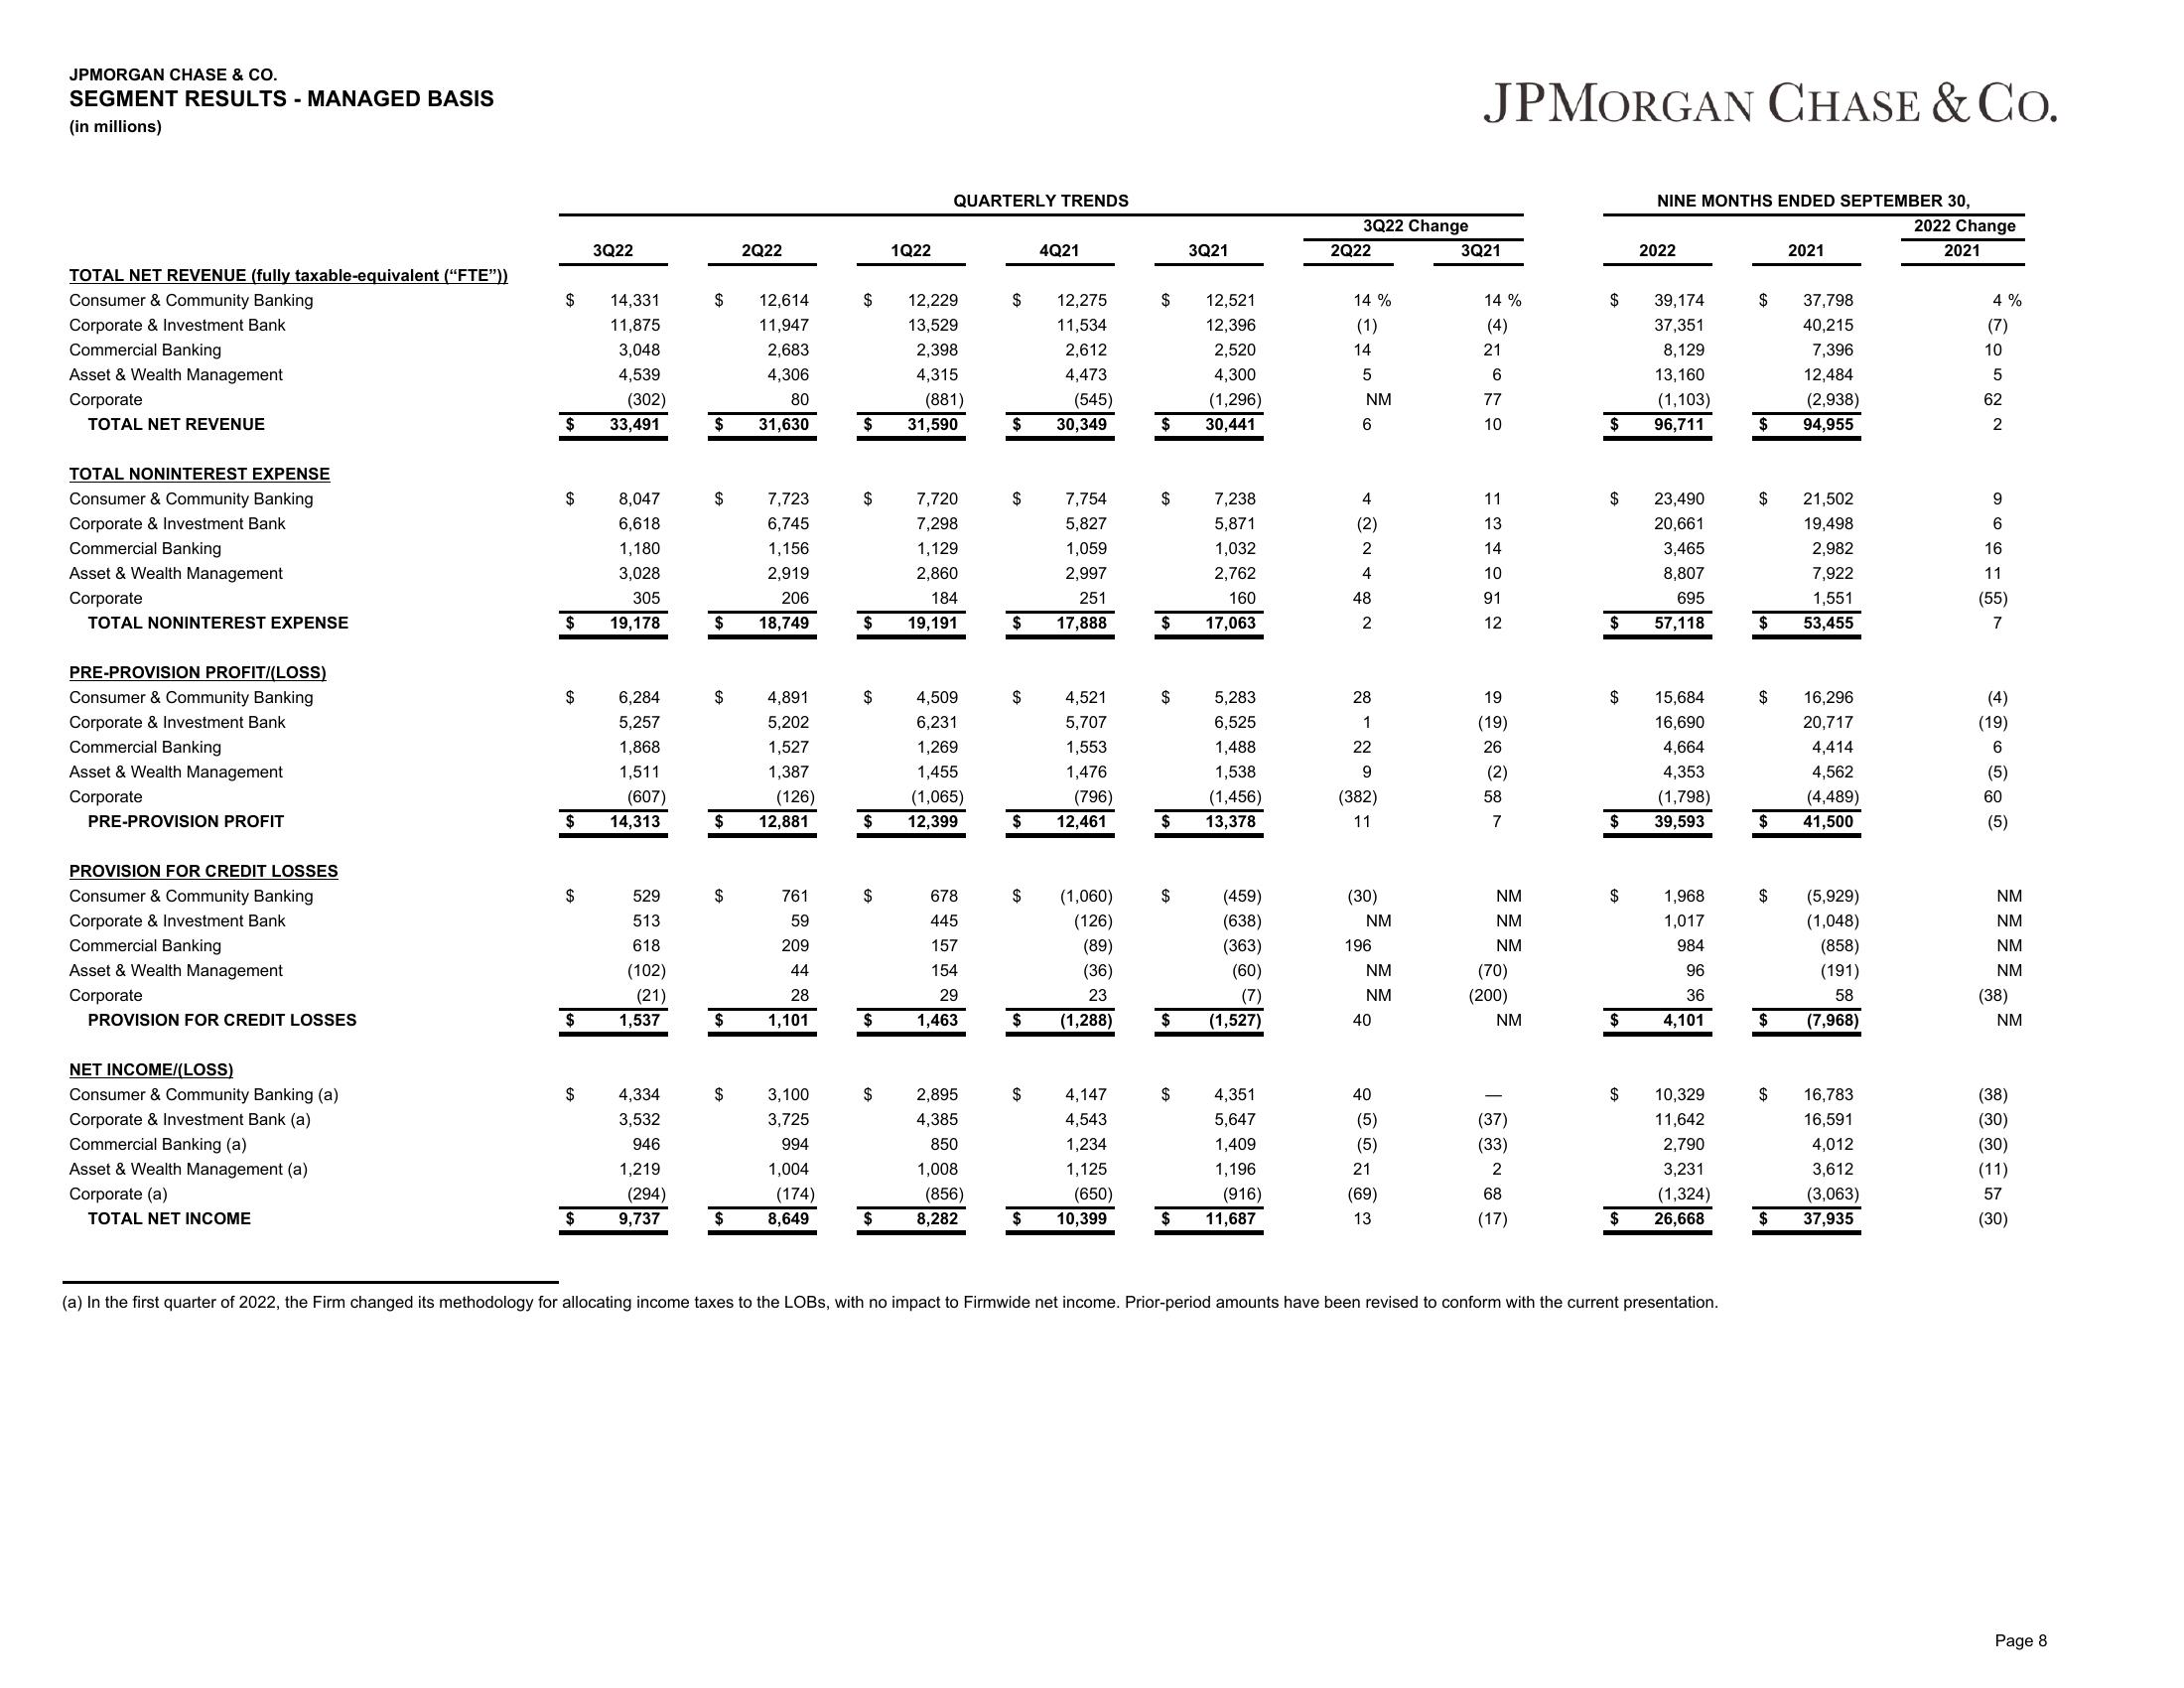
SEGMENT RESULTS - MANAGED BASIS
(in millions)
TOTAL NET REVENUE (fully taxable-equivalent ("FTE"))
Consumer & Community Banking
Corporate & Investment Bank
Commercial Banking
Asset & Wealth Management
Corporate
TOTAL NET REVENUE
TOTAL NONINTEREST EXPENSE
Consumer & Community Banking
Corporate & Investment Bank
Commercial Banking
Asset & Wealth Management
Corporate
TOTAL NONINTEREST EXPENSE
PRE-PROVISION PROFIT/(LOSS)
Consumer & Community Banking
Corporate & Investment Bank
Commercial Banking
Asset & Wealth Management
Corporate
PRE-PROVISION PROFIT
PROVISION FOR CREDIT LOSSES
Consumer & Community Banking
Corporate & Investment Bank
Commercial Banking
Asset & Wealth Management
Corporate
PROVISION FOR CREDIT LOSSES
NET INCOME/(LOSS)
Consumer & Community Banking (a)
Corporate & Investment Bank (a)
Commercial Banking (a)
Asset & Wealth Management (a)
Corporate (a)
TOTAL NET INCOME
$
$
$
$
$
$
$
$
3Q22
(607)
$ 14,313
$
14,331
11,875
3,048
4,539
(302)
33,491
8,047
6,618
1,180
3,028
305
19,178
6,284
5,257
1,868
1,511
529
513
618
(102)
(21)
1,537
4,334
3,532
946
1,219
(294)
9,737
$
$
$
7,723
6,745
1,156
2,919
206
$ 18,749
$
$
2Q22
(126)
$ 12,881
$
12,614
11,947
2,683
4,306
80
31,630
$
4,891
5,202
1,527
1,387
761
59
209
44
28
1,101
3,100
3,725
994
1,004
(174)
8,649
$
12,229
13,529
2,398
4,315
(881)
$ 31,590
$
$
$
$
$
$
1Q22
$
QUARTERLY TRENDS
7,720
7,298
1,129
2,860
184
19,191
4,509
6,231
1,269
1,455
(1,065)
12,399
678
445
157
154
29
1,463
2,895
4,385
850
1,008
(856)
8,282
$
$
(545)
$ 30,349
$
7,754
5,827
1,059
2,997
251
$ 17,888
$
4Q21
$
12,275
11,534
2,612
4,473
$
4,521
5,707
1,553
1,476
(796)
12,461
4,147
4,543
1,234
1,125
$
(650)
$ 10,399
$
$
$
$
(1,060) $
(126)
(89)
(36)
23
(1,288)
$
$
$
$
3Q21
12,521
12,396
2,520
4,300
(1,296)
30,441
7,238
5,871
1,032
2,762
160
17,063
5,283
6,525
1,488
1,538
(1,456)
13,378
(459)
(638)
(363)
(60)
(7)
(1,527)
4,351
5,647
1,409
1,196
(916)
11,687
3Q22 Change
2Q22
14%
(1)
14
5
NM
6
4
(2)
2
4
48
2
28
1
22
9
(382)
11
(30)
NM
196
NM
NM
40
40
(5)
(5)
21
(69)
13
JPMORGAN CHASE & CO.
3Q21
14%
21
6
10
11
13
14
10
91
12
19
(19)
26
(2)
58
7
NM
NM
NM
(70)
(200)
NM
(37)
(33)
2
68
(17)
$
$
$
23,490
20,661
3,465
8,807
695
$ 57,118
$
$
$ 15,684
16,690
4,664
4,353
(1,798)
39,593
$
NINE MONTHS ENDED SEPTEMBER 30,
$
2022
$
39,174
37,351
8,129
13,160
(1,103)
96,711
1,968
1,017
984
96
36
4,101
10,329
11,642
2,790
3,231
(1,324)
26,668
(a) In the first quarter of 2022, the Firm changed its methodology for allocating income taxes to the LOBS, with no impact to Firmwide net income. Prior-period amounts have been revised to conform with the current presentation.
$
$
12,484
(2,938)
$ 94,955
$
$
$
$
$
$
2021
$
37,798
40,215
7,396
21,502
19,498
2,982
7,922
1,551
53,455
16,296
20,717
4,414
4,562
(4,489)
41,500
(5,929)
(1,048)
(858)
(191)
58
(7,968)
16,783
16,591
4,012
3,612
(3,063)
37,935
2022 Change
2021
4%
(7)
10
5
62
2
9
6
16
11
(55)
7
(4)
(19)
6
(5)
60
(5)
NM
NM
NM
NM
(38)
NM
(38)
(30)
(30)
(11)
57
(30)
Page 8View entire presentation