Tesla Results Presentation Deck
9
VEHICLE CAPACITY
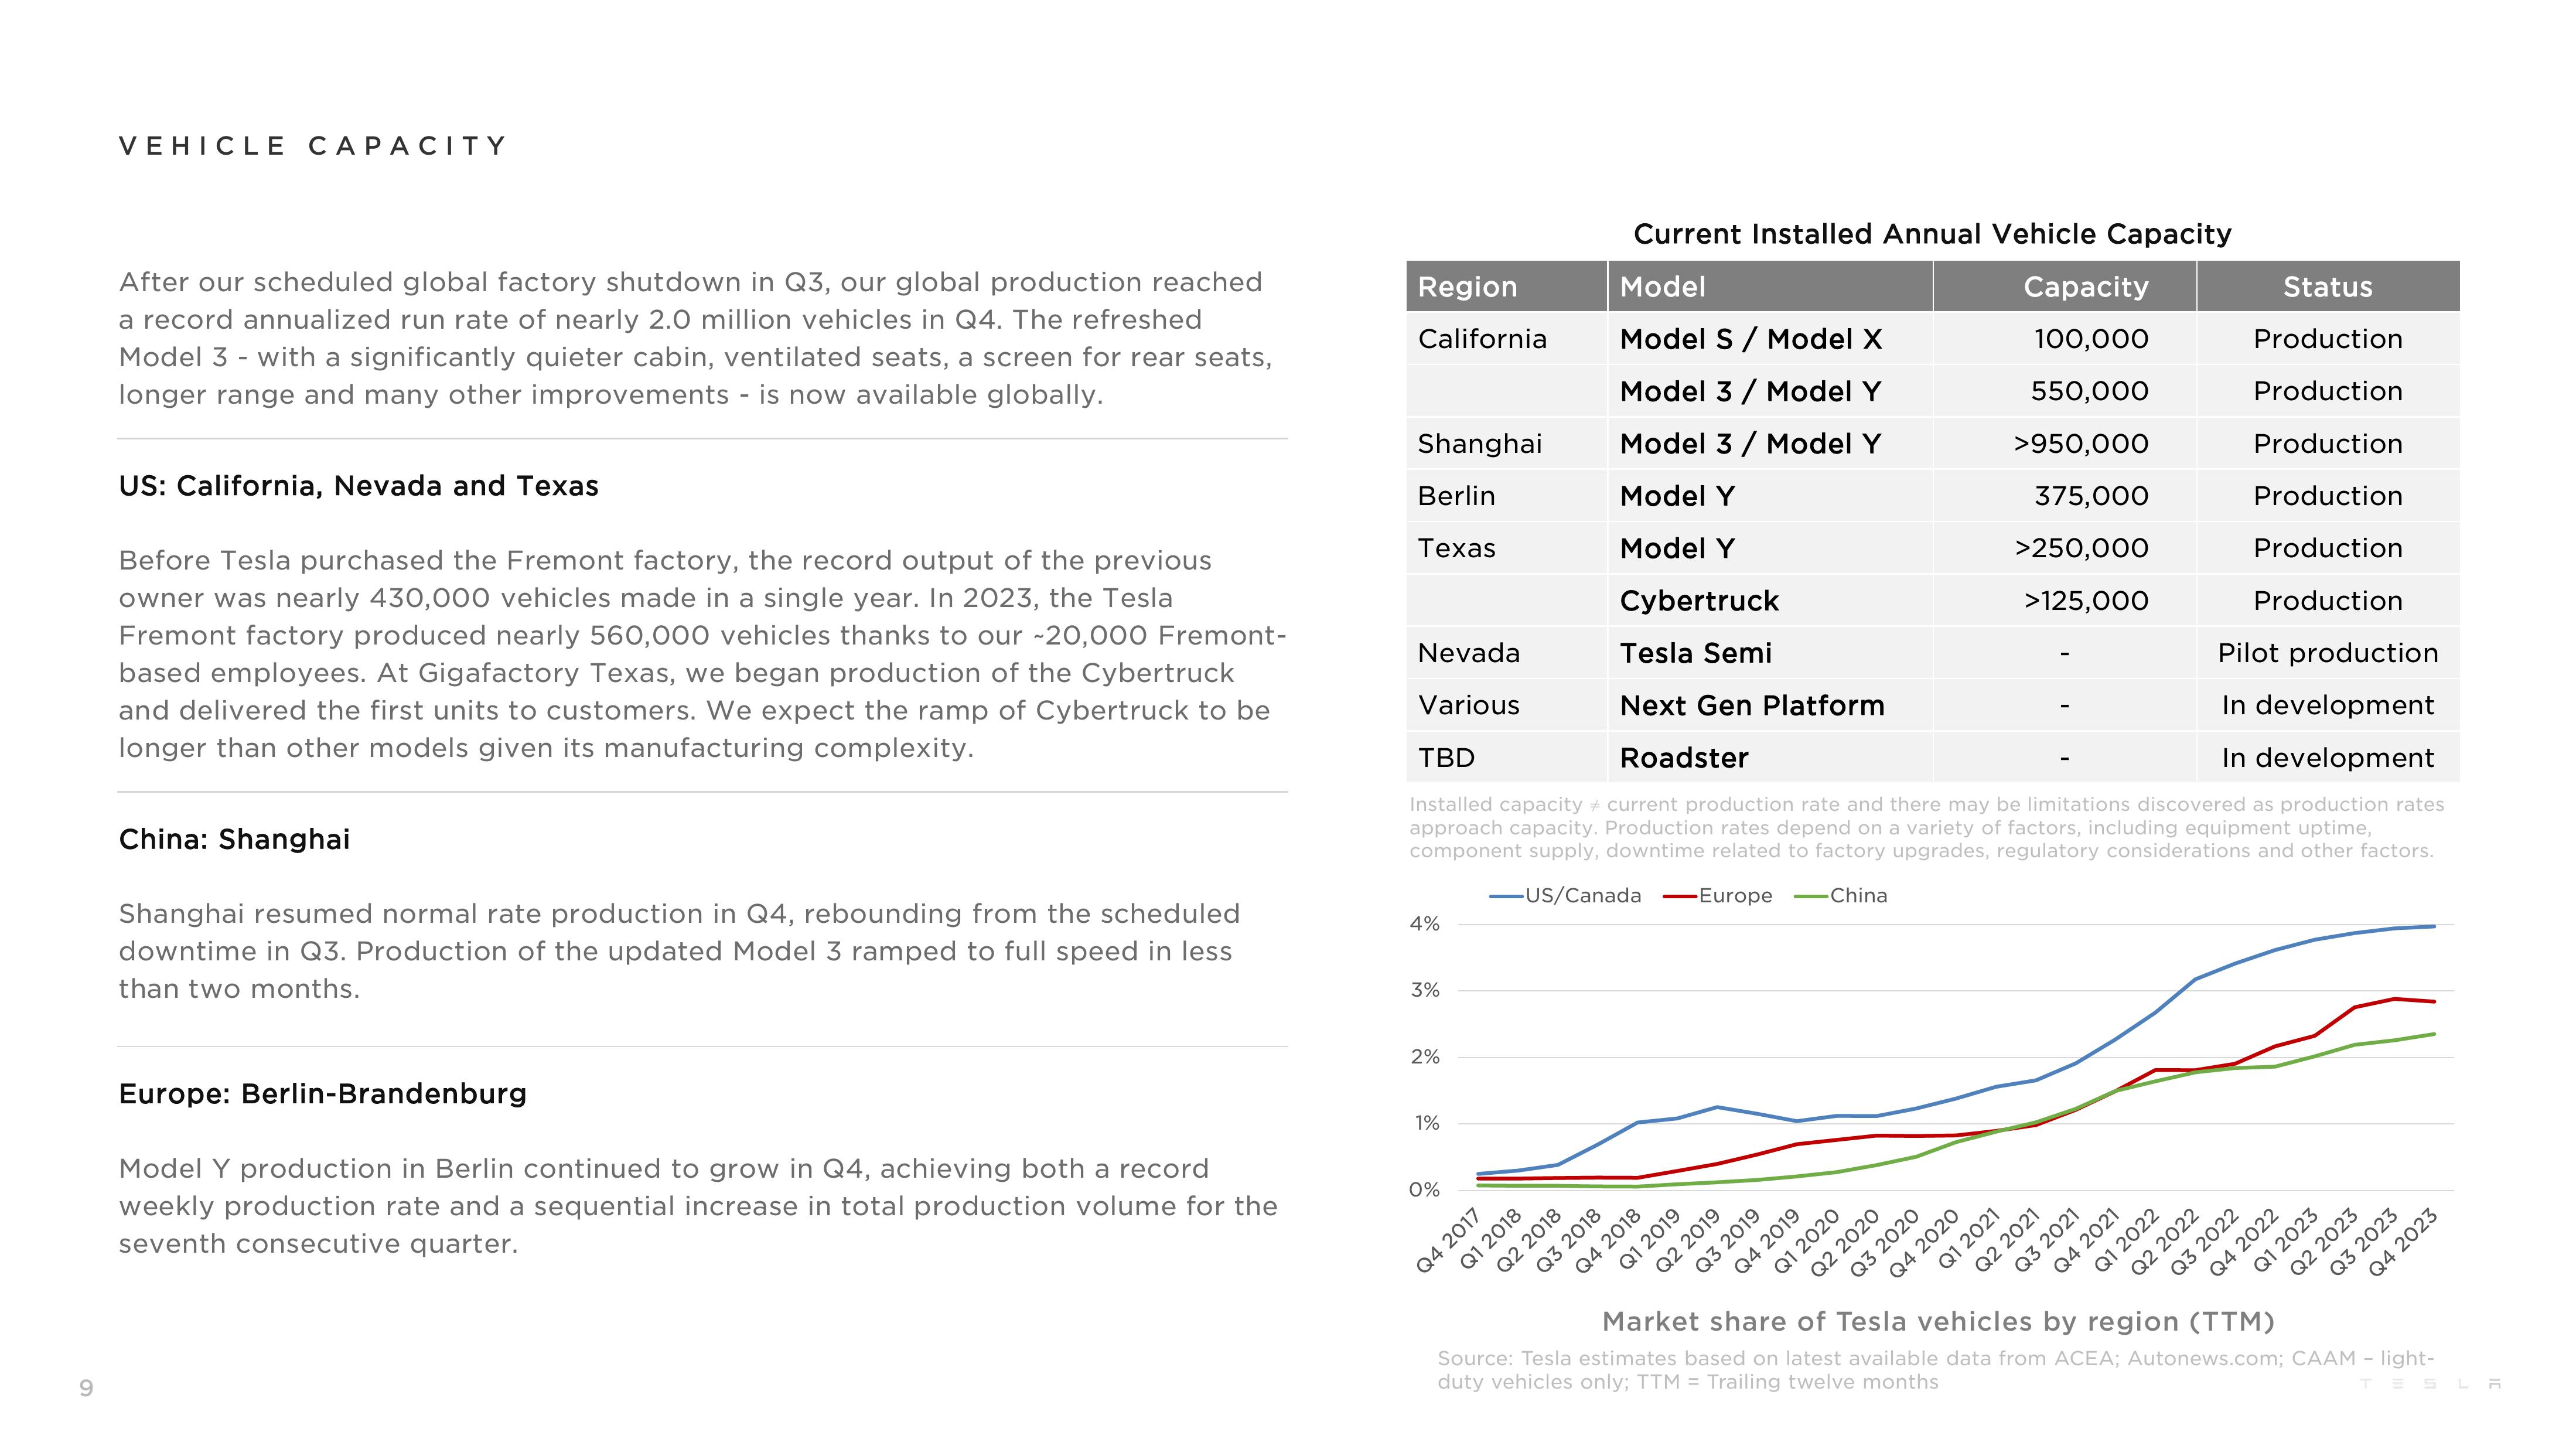
After our scheduled global factory shutdown in Q3, our global production reached
a record annualized run rate of nearly 2.0 million vehicles in Q4. The refreshed
Model 3 - with a significantly quieter cabin, ventilated seats, a screen for rear seats,
longer range and many other improvements - is now available globally.
US: California, Nevada and Texas
Before Tesla purchased the Fremont factory, the record output of the previous
owner was nearly 430,000 nicles made in a single year. In 2023, the Tesla
Fremont factory produced nearly 560,000 vehicles thanks to our -20,000 Fremont-
based employees. At Gigafactory Texas, we began production of the Cybertruck
and delivered the first units to customers. We expect the ramp of Cybertruck to be
longer than other models given its manufacturing complexity.
China: Shanghai
Shanghai resumed normal rate production in Q4, rebounding from the scheduled
downtime in Q3. Production of the updated Model 3 ramped to full speed in less
than two months.
Europe: Berlin-Brandenburg
Model Y production in Berlin continued to grow in Q4, achieving both a record
weekly production rate and a sequential increase in total production volume for the
seventh consecutive quarter.
Region
California
Shanghai
Berlin
Texas
Nevada
Various
4%
Pilot production
In development
In development
TBD
Installed capacity current production rate and there may be limitations discovered as production rates
approach capacity. Production rates depend on a variety of factors, including equipment uptime,
component supply, downtime related to factory upgrades, regulatory considerations and
-US/Canada -Europe -China
other factors.
3%
2%
1%
0%
Q4 2017
Q1 2018
Q2 2018
Current Installed Annual Vehicle Capacity
Model
Model S / Model X
Model 3 / Model Y
Model 3 / Model Y
Model Y
Model Y
Cybertruck
Q3
Tesla Semi
Next Gen Platform
Roadster
2018
Q4 2018
Q1 2019
Q3 2019
Q2 2019
Q4 2019
Q1 2020
Q2 2020
Q3 2020
Q4 2020
Capacity
100,000
550,000
>950,000
375,000
>250,000
>125,000
Q1 2021
Q2 2021
Q3 2021
Q4 2021
Q1 2022
Q2 2022
Status
Production
Production
Production
Production
Production
Production
Q3 2022
Q4 2022
Q1 2023
Q2 2023
Q3 2023
Q4 2023
Market share of Tesla
vehicles
by region (TTM)
Source: Tesla estimates based on latest available data from ACEA; Autonews.com; CAAM - light-
duty vehicles only; TTM = Trailing twelve monthsView entire presentation