Bill.com Investor Presentation Deck
Our financial profile
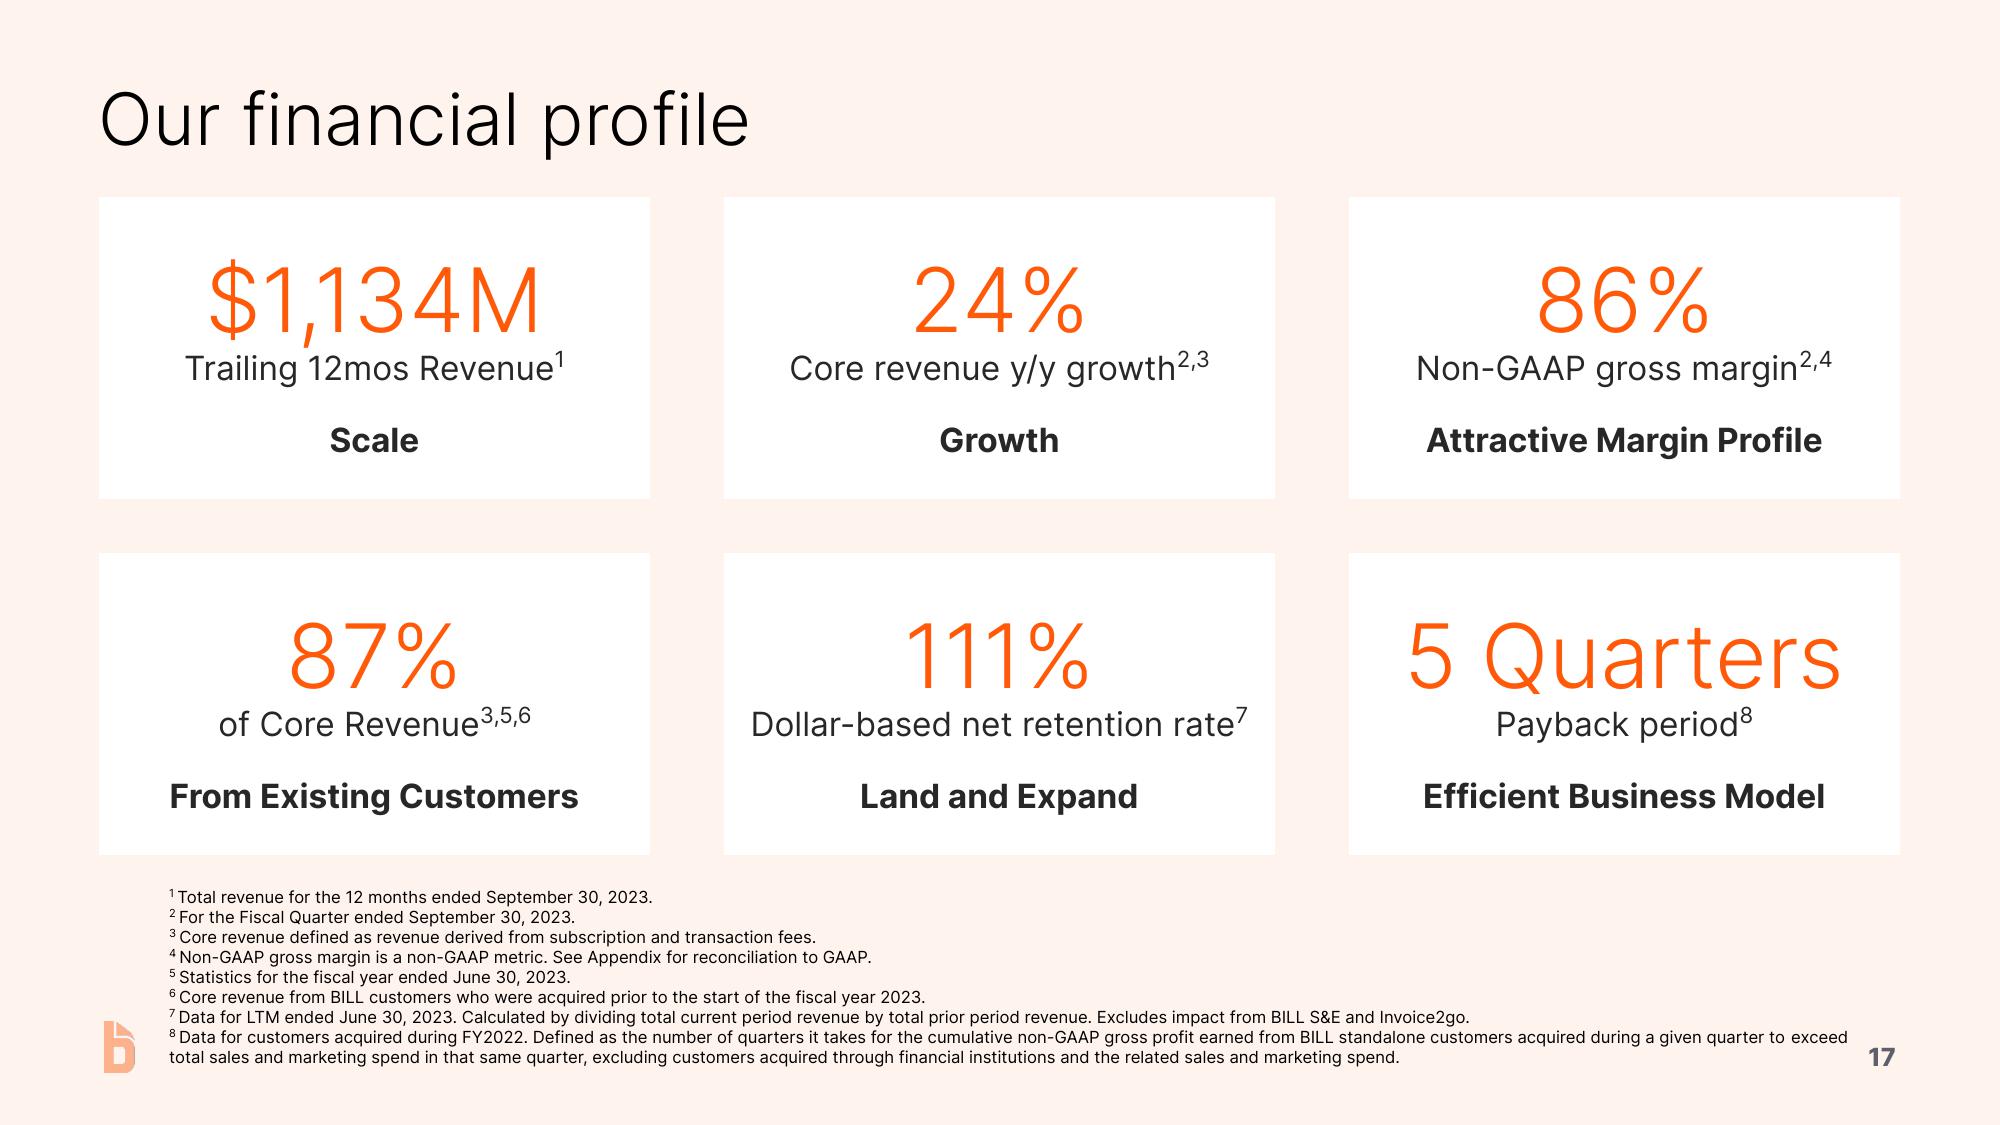
$1,134M
Trailing 12mos Revenue¹
Scale
87%
of Core Revenue 3,5,6
From Existing Customers
24%
Core revenue y/y growth²,3
Growth
111%
Dollar-based net retention rate7
Land and Expand
86%
Non-GAAP gross margin²,4
Attractive Margin Profile
5 Quarters
Payback period
Efficient Business Model
¹ Total revenue for the 12 months ended September 30, 2023.
2 For the Fiscal Quarter ended September 30, 2023.
³ Core revenue defined as revenue derived from subscription and transaction fees.
4 Non-GAAP gross margin is a non-GAAP metric. See Appendix for reconciliation to GAAP.
5 Statistics for the fiscal year ended June 30, 2023.
6 Core revenue from BILL customers who were acquired prior to the start of the fiscal year 2023.
7 Data for LTM ended June 30, 2023. Calculated by dividing total current period revenue by total prior period revenue. Excludes impact from BILL S&E and Invoice2go.
8 Data for customers acquired during FY2022. Defined as the number of quarters it takes for the cumulative non-GAAP gross profit earned from BILL standalone customers acquired during a given quarter to exceed
total sales and marketing spend in that same quarter, excluding customers acquired through financial institutions and the related sales and marketing spend.
17View entire presentation