PJT Partners Investment Banking Pitch Book
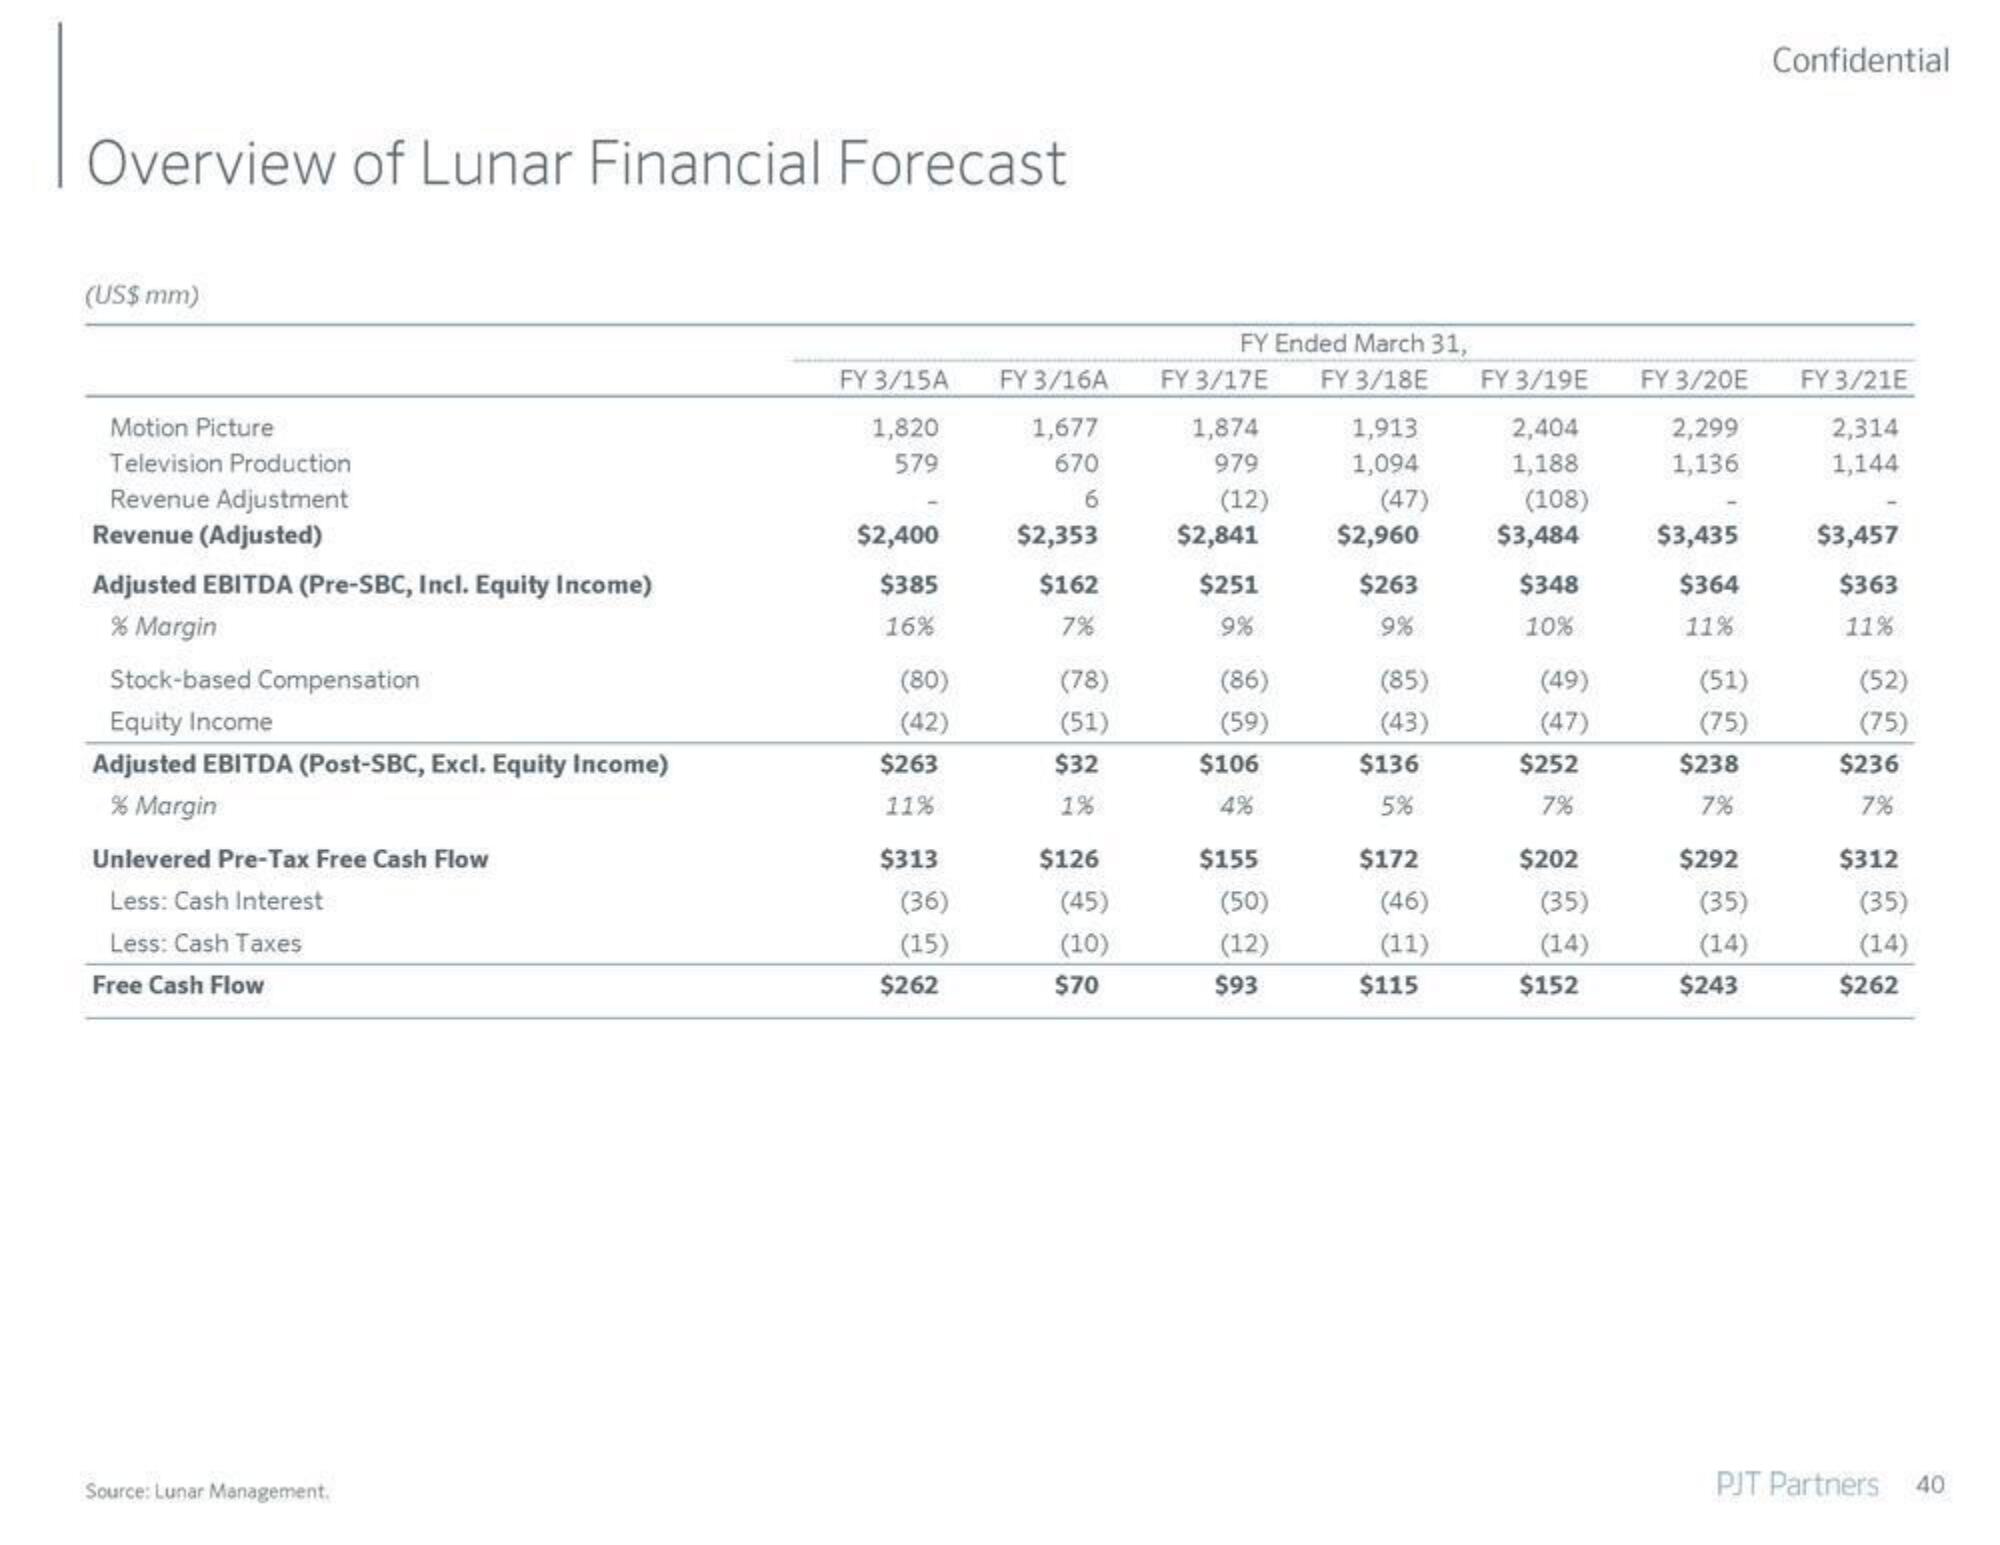
Overview of Lunar Financial Forecast
(US$ mm)
Motion Picture
Television Production
Revenue Adjustment
Revenue (Adjusted)
Adjusted EBITDA (Pre-SBC, Incl. Equity Income)
% Margin
Stock-based Compensation
Equity Income
Adjusted EBITDA (Post-SBC, Excl. Equity Income)
% Margin
Unlevered Pre-Tax Free Cash Flow
Less: Cash Interest
Less: Cash Taxes
Free Cash Flow
Source: Lunar Management.
FY 3/15A
1,820
579
$2,400
$385
16%
(80)
(42)
$263
11%
$313
(36)
(15)
$262
FY 3/16A
1,677
670
6
$2,353
$162
7%
(78)
(51)
$32
1%
$126
(45)
(10)
$70
FY Ended March 31,
FY 3/17E FY 3/18E
1,874
979
(12)
$2,841
$251
9%
(86)
(59)
$106
4%
$155
(50)
(12)
$93
1,913
1,094
(47)
$2,960
$263
9%
(85)
(43)
$136
5%
$172
(46)
(11)
$115
FY 3/19E
2,404
1,188
(108)
$3,484
$348
10%
(49)
(47)
$252
7%
$202
(35)
(14)
$152
FY 3/20E
2,299
1,136
$3,435
$364
11%
(51)
(75)
$238
7%
$292
(35)
(14)
$243
Confidential
FY 3/21E
2,314
1,144
$3,457
$363
11%
(52)
(75)
$236
7%
$312
(35)
(14)
$262
PJT Partners
40View entire presentation