Acast Results Presentation Deck
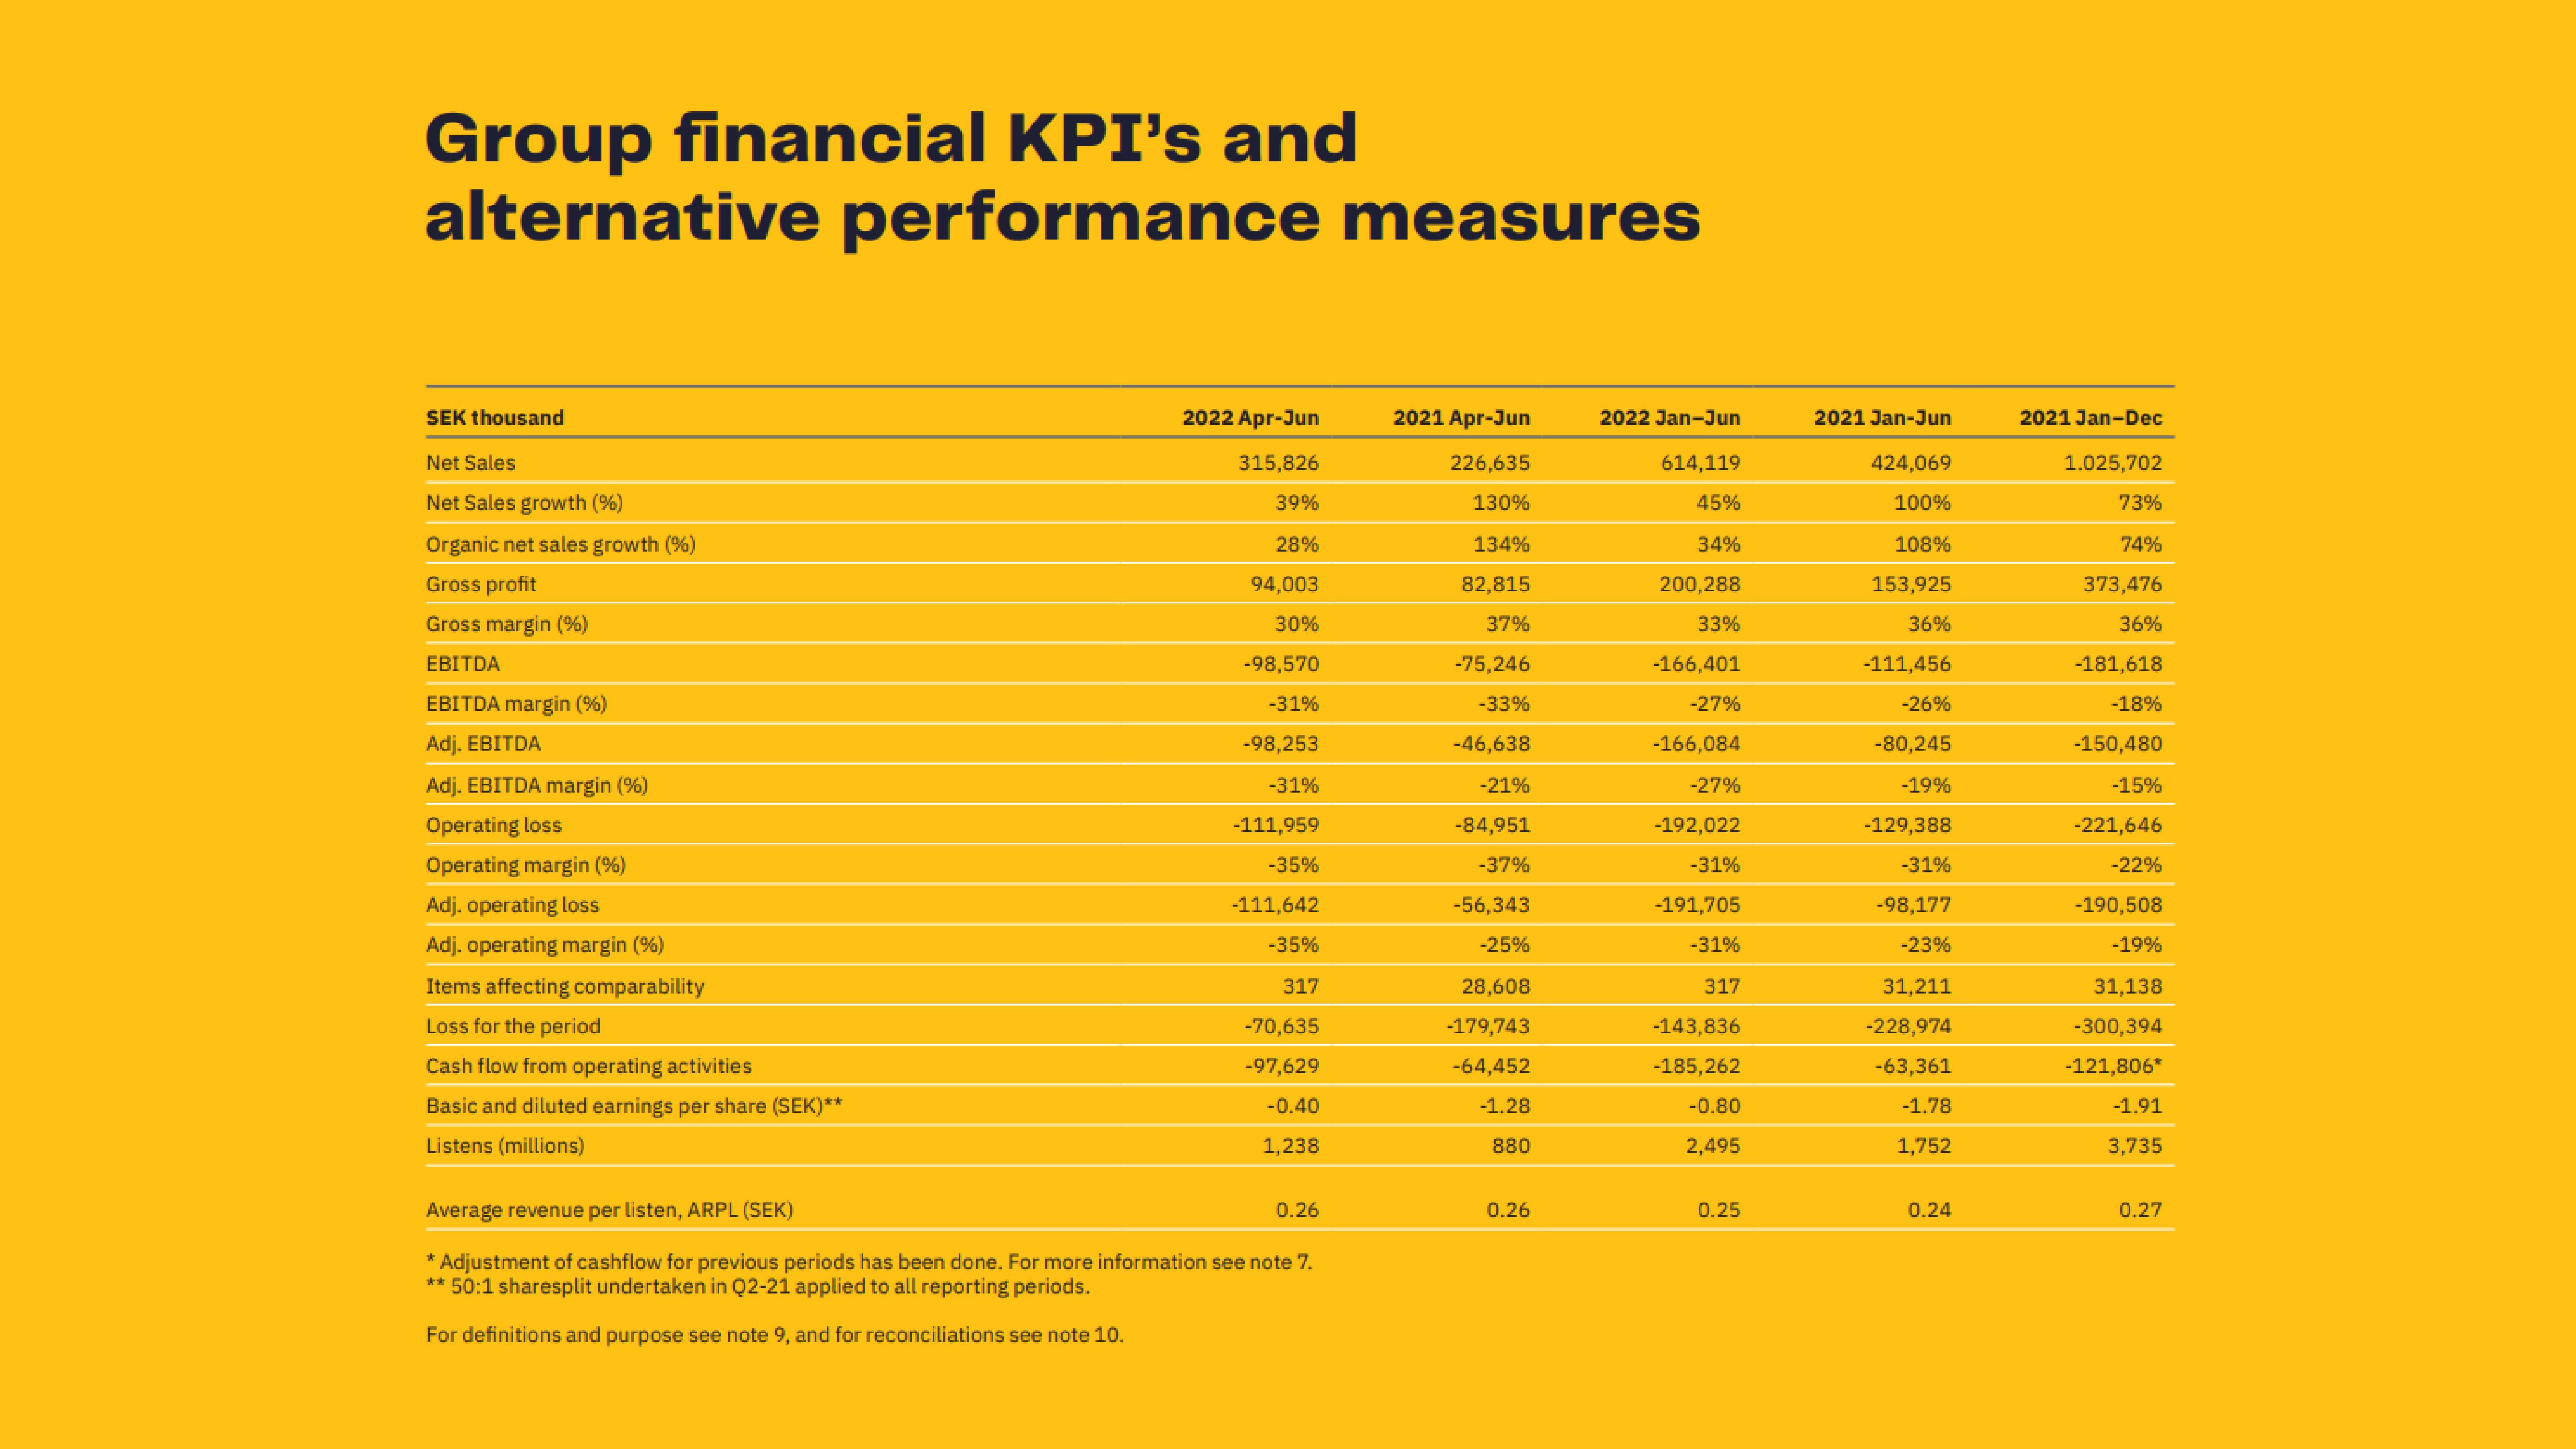
Group financial KPI's and
alternative performance measures
SEK thousand
Net Sales
Net Sales growth (%)
Organic net sales growth (%)
Gross profit
Gross margin (%)
EBITDA
EBITDA margin (%)
Adj. EBITDA
Adj. EBITDA margin (%)
Operating loss
Operating margin (%)
Adj. operating loss
Adj. operating margin (%)
Items affecting comparability
Loss for the period
Cash flow from operating activities
Basic and diluted earnings per share (SEK)**
Listens (millions)
2022 Apr-Jun
315,826
39%
28%
94,003
30%
-98,570
-31%
-98,253
-31%
-111,959
-35%
-111,642
-35%
317
-70,635
-97,629
-0.40
1,238
Average revenue per listen, ARPL (SEK)
* Adjustment of cashflow for previous periods has been done. For more information see note 7.
** 50:1 sharesplit undertaken in Q2-21 applied to all reporting periods.
For definitions and purpose see note 9, and for reconciliations see note 10.
0.26
2021 Apr-Jun
226,635
130%
134%
82,815
37%
-75,246
-33%
-46,638
-21%
-84,951
-37%
-56,343
-25%
28,608
-179,743
-64,452
-1.28
880
0.26
2022 Jan-Jun
614,119
45%
34%
200,288
33%
-166,401
-27%
-166,084
-27%
-192,022
-31%
-191,705
-31%
317
-143,836
-185,262
-0.80
2,495
0.25
2021 Jan-Jun
424,069
100%
108%
153,925
36%
-111,456
-26%
-80,245
-19%
-129,388
-31%
-98,177
-23%
31,211
-228,974
-63,361
-1.78
1,752
0.24
2021 Jan-Dec
1.025,702
73%
74%
373,476
36%
-181,618
-18%
-150,480
-15%
-221,646
-22%
-190,508
-19%
31,138
-300,394
-121,806*
-1.91
3,735
0.27View entire presentation