Pinterest Results Presentation Deck
Cost of Revenue
18%
127
Q420
S&M
15%
109
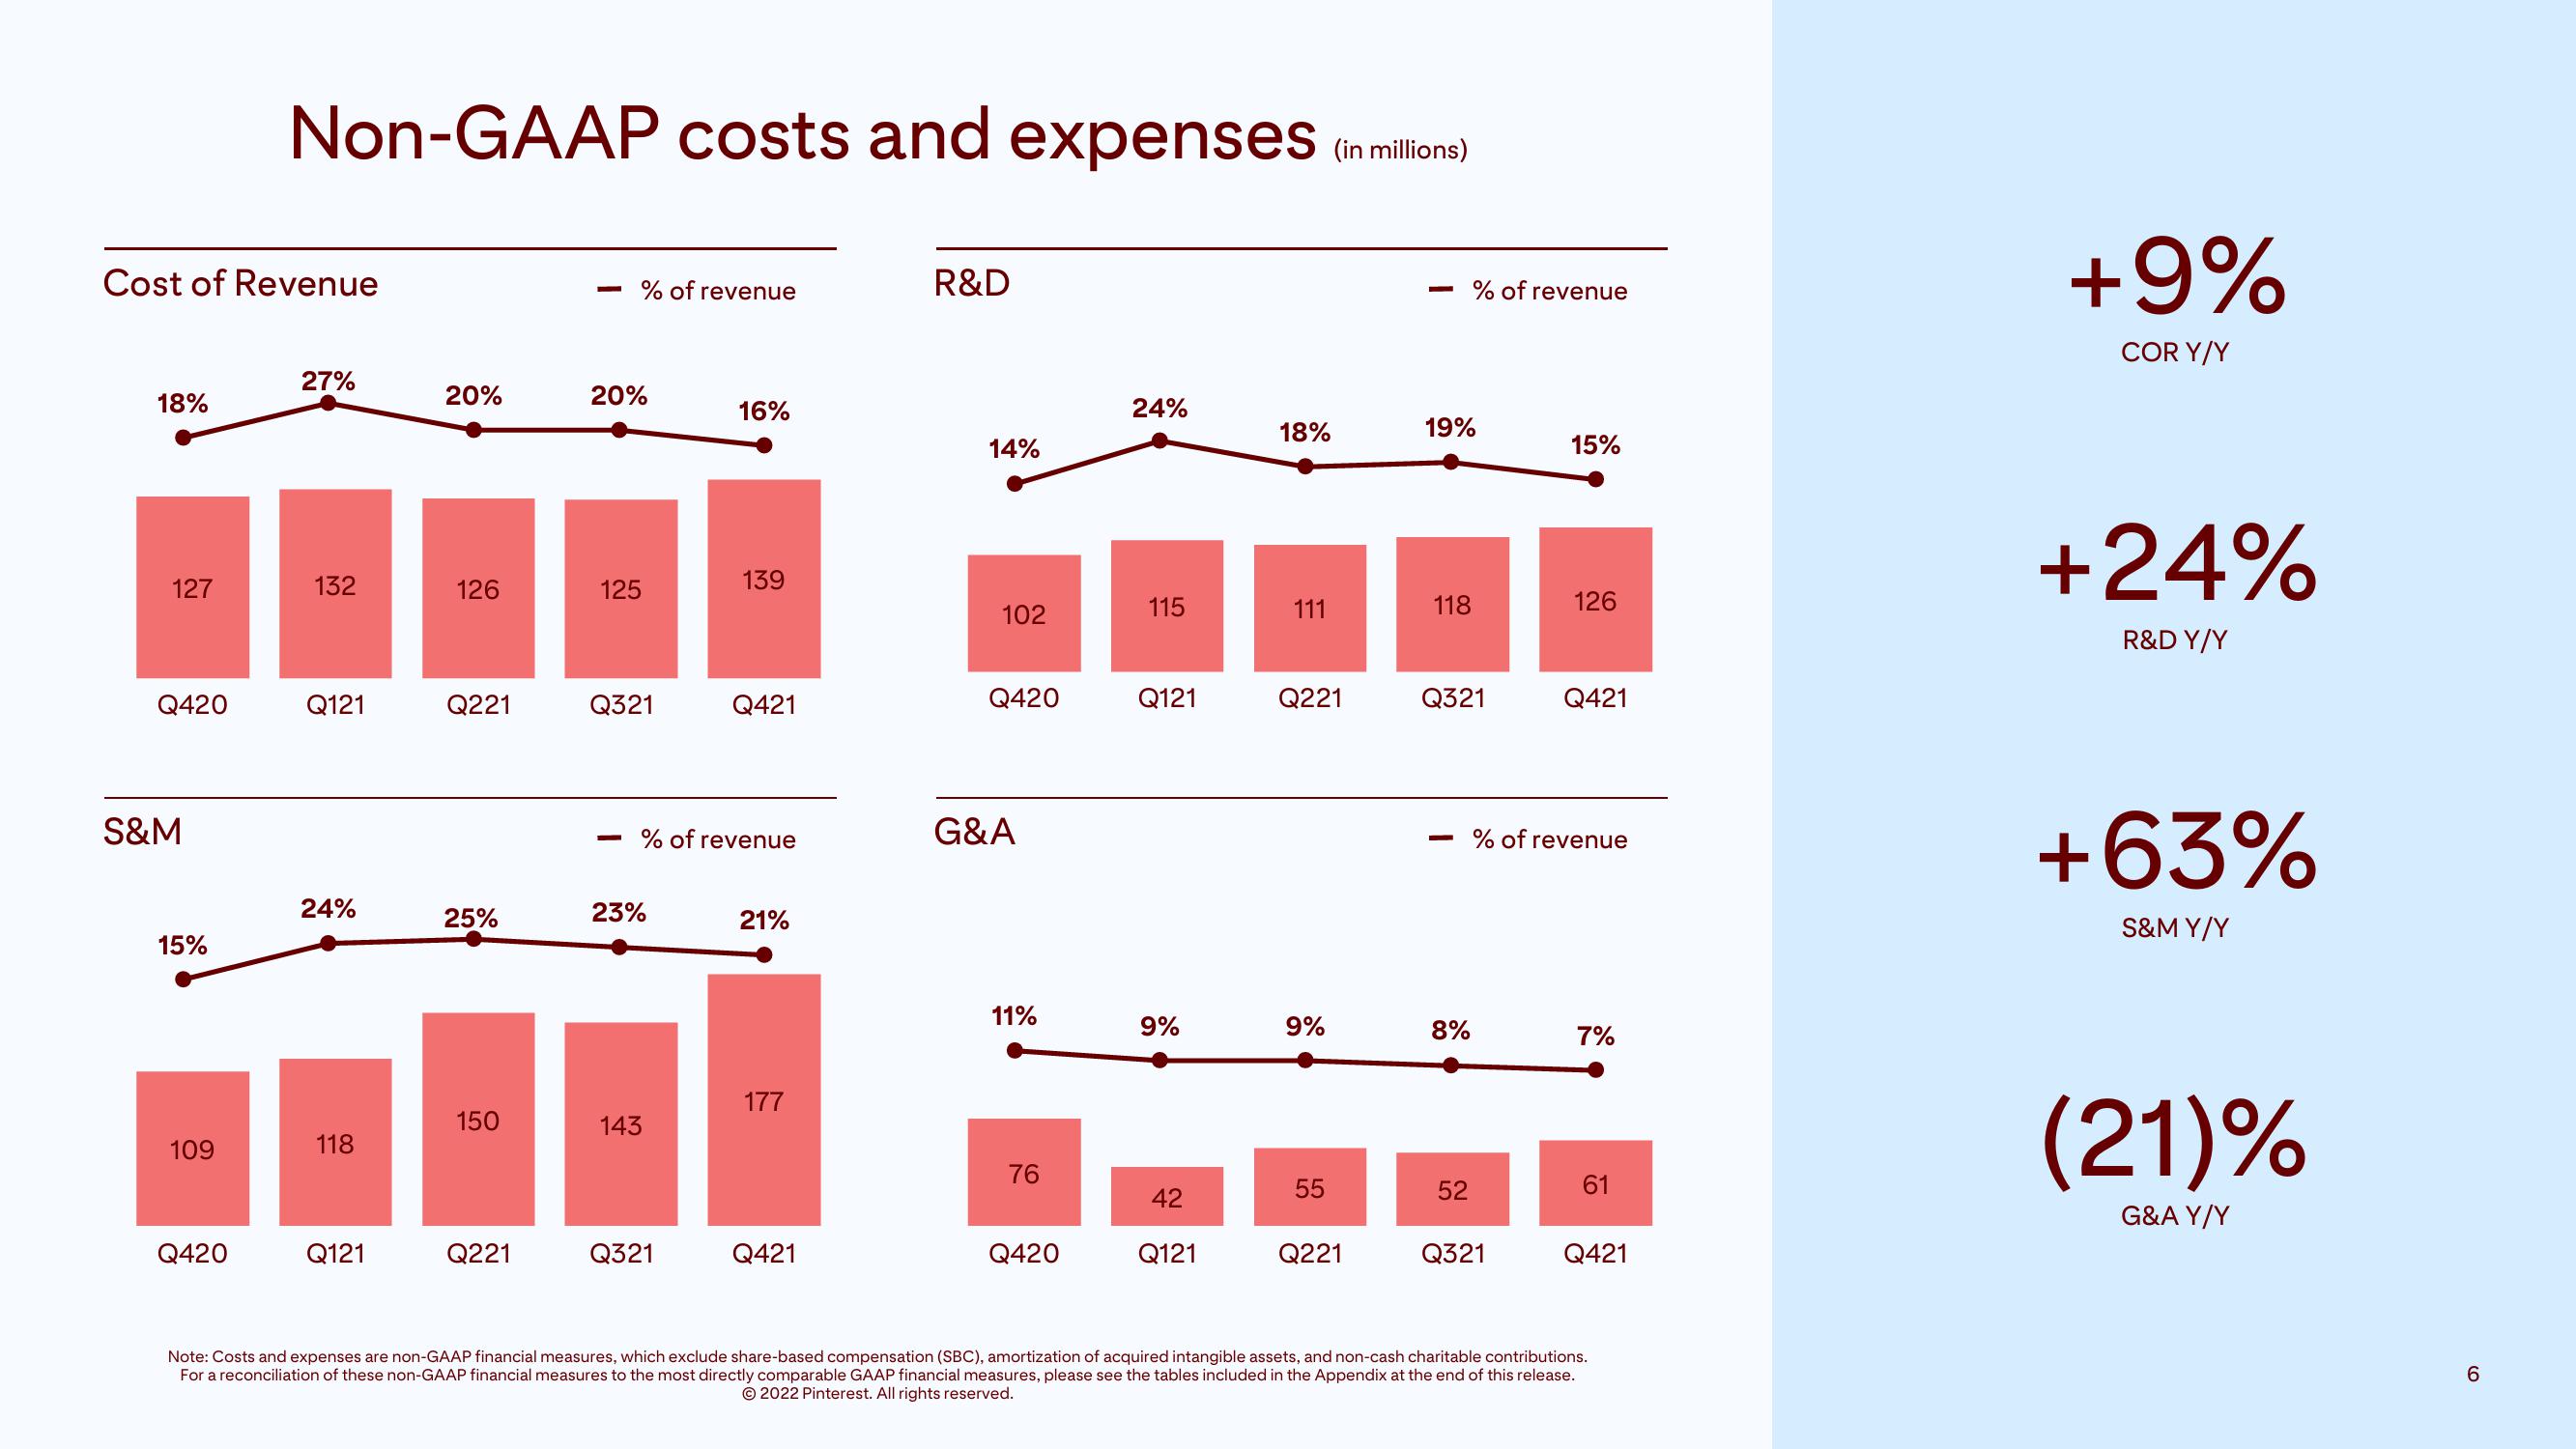
Non-GAAP costs and expenses (in millions)
Q420
27%
132
Q121
24%
118
Q121
20%
126
Q221
25%
150
Q221
% of revenue
20%
125
Q321
23%
143
16%
% of revenue
Q321
139
Q421
21%
177
Q421
R&D
14%
102
Q420
G&A
11%
76
Q420
24%
115
Q121
9%
42
Q121
18%
111
Q221
9%
55
Q221
—
19%
118
% of revenue
Q321
8%
52
15%
Q321
126
Q421
% of revenue
7%
61
Q421
Note: Costs and expenses are non-GAAP financial measures, which exclude share-based compensation (SBC), amortization of acquired intangible assets, and non-cash charitable contributions.
For a reconciliation of these non-GAAP financial measures to the most directly comparable GAAP financial measures, please see the tables included in the Appendix at the end of this release.
2022 Pinterest. All rights reserved.
+9%
COR Y/Y
+24%
R&D Y/Y
+63%
S&M Y/Y
(21)%
G&A Y/Y
6View entire presentation