Apollo Global Management Investor Presentation Deck
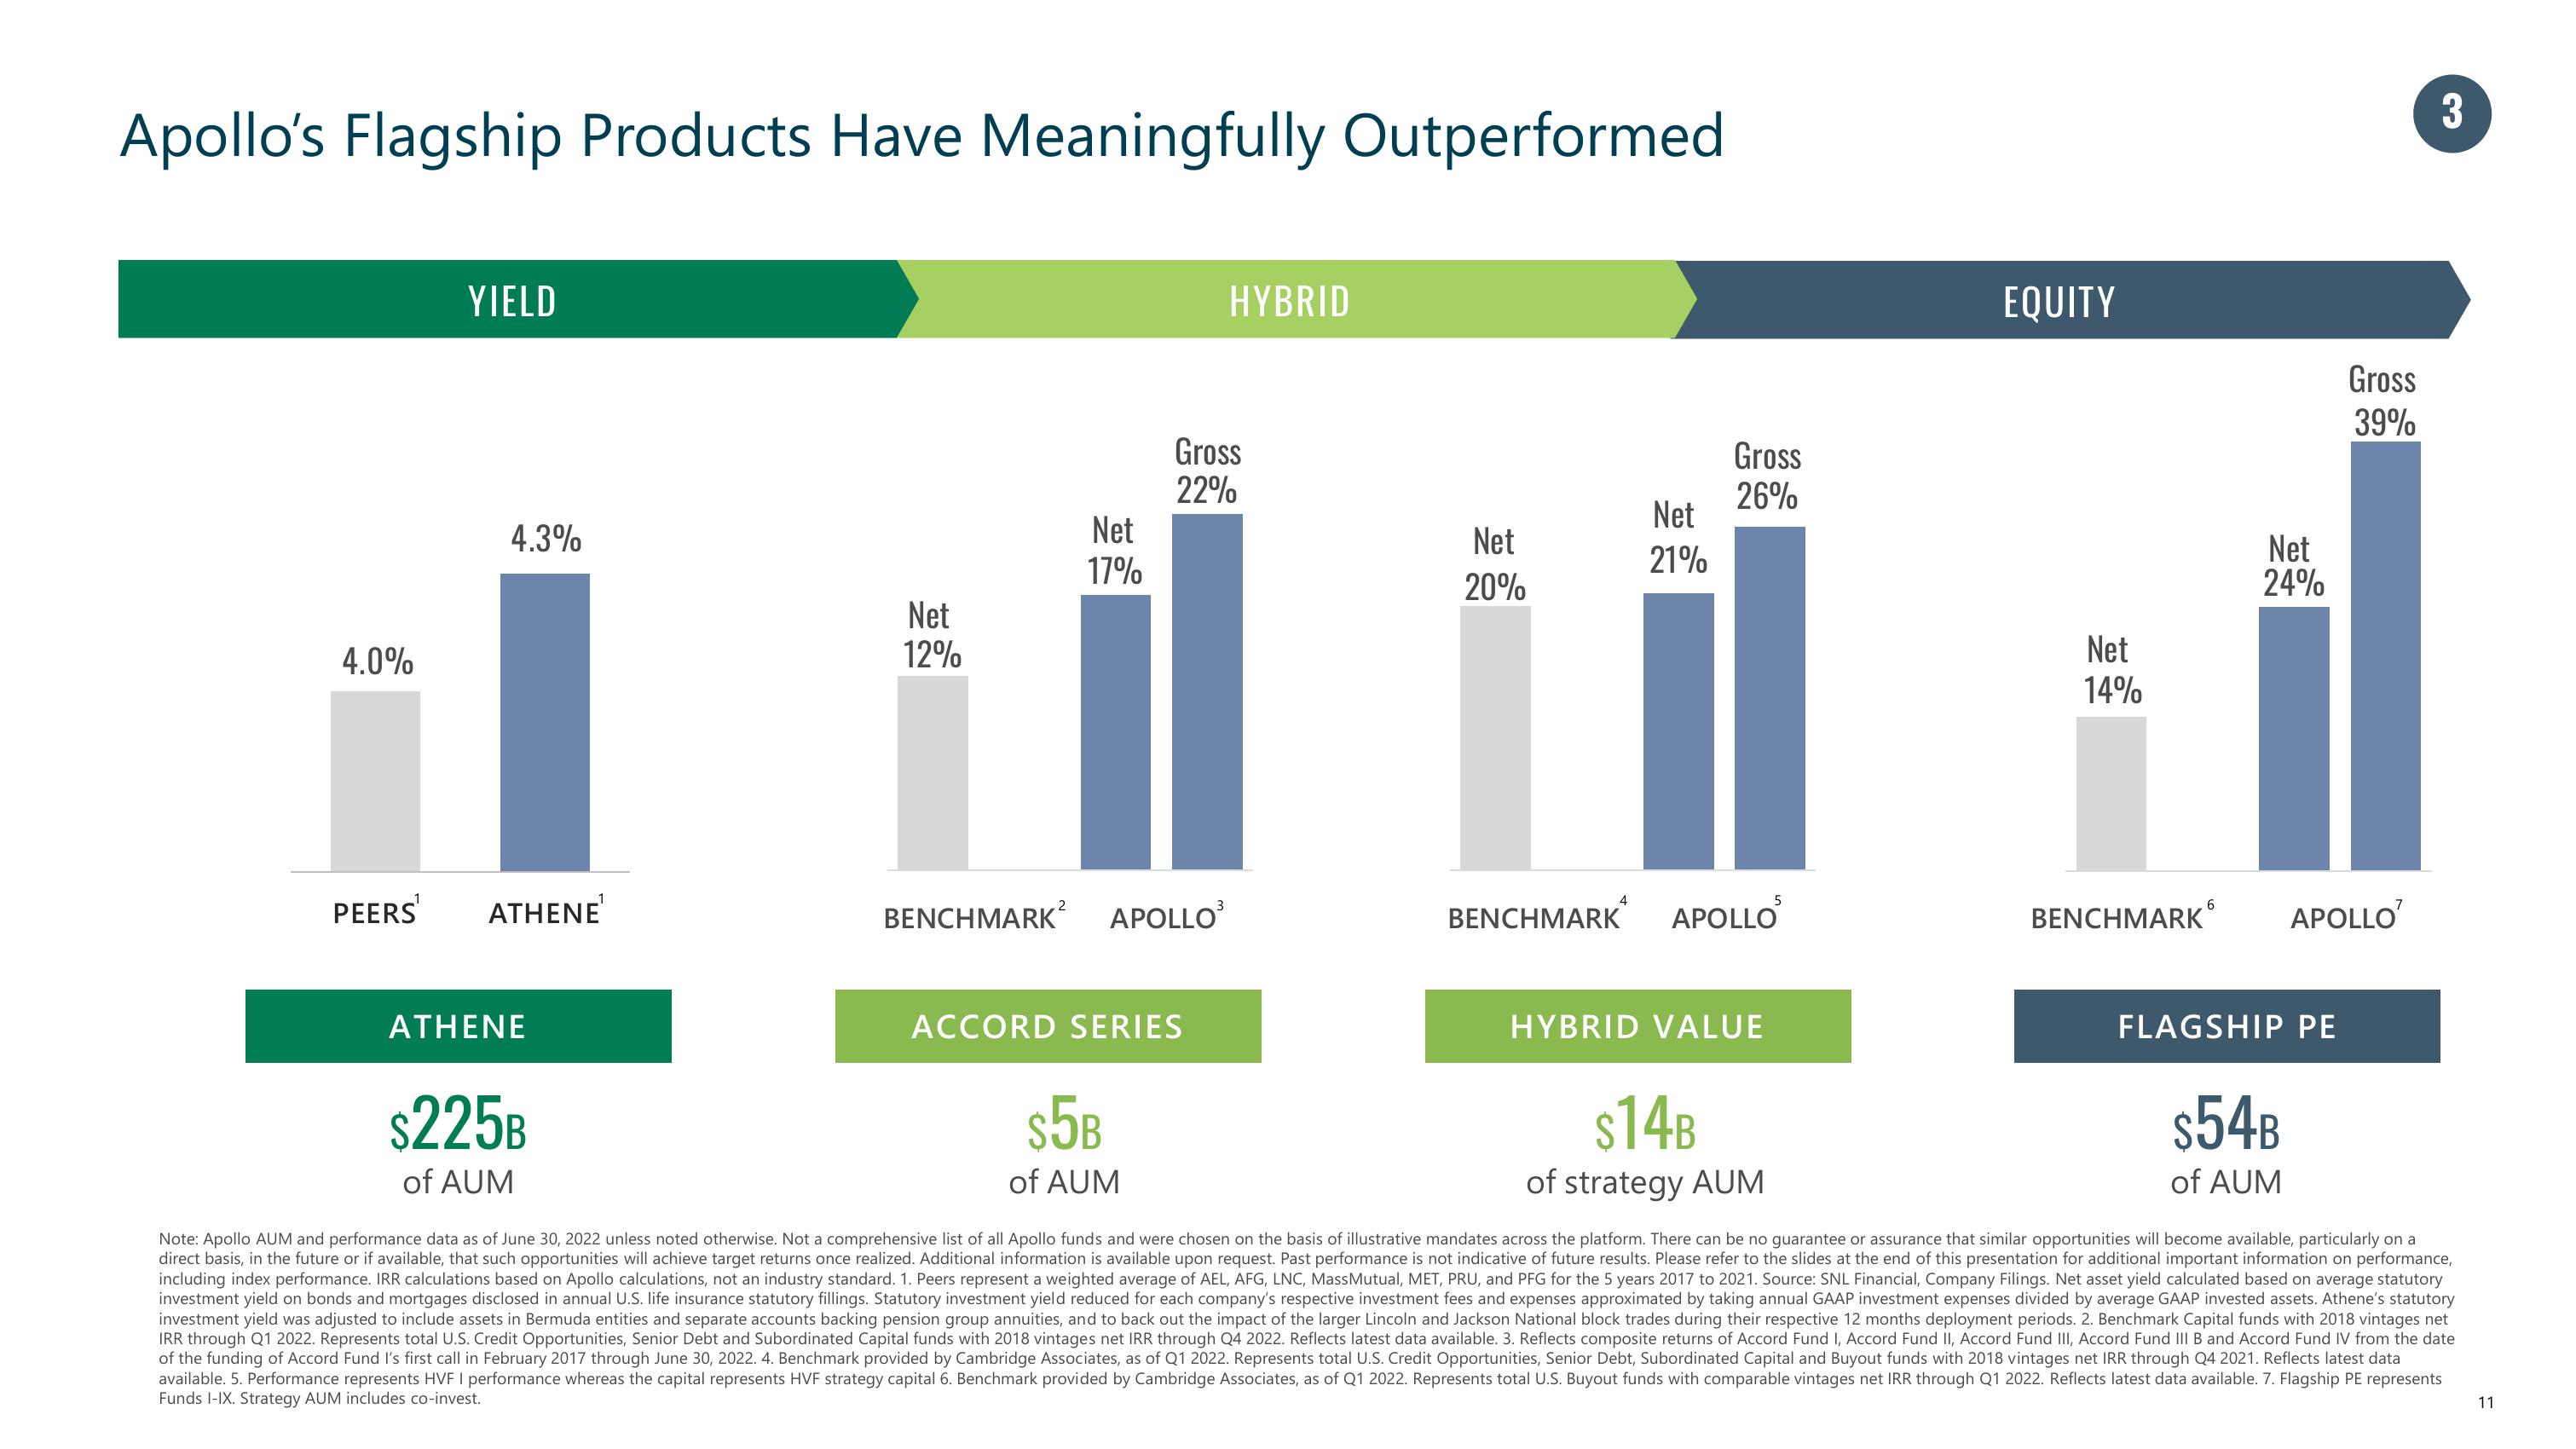
Apollo's Flagship Products Have Meaningfully Outperformed
4.0%
PEERS¹
YIELD
4.3%
ATHENE
ATHENE
$225B
of AUM
Net
12%
Net
17%
BENCHMARK² APOLLO³
Gross
22%
ACCORD SERIES
$5B
of AUM
HYBRID
Net
20%
Net
21%
Gross
26%
BENCHMARK APOLLO
HYBRID VALUE
5
$14B
of strategy AUM
EQUITY
Net
14%
BENCHMARK
6
Net
24%
FLAGSHIP PE
$54B
of AUM
Gross
39%
7
APOLLO
3
Note: Apollo AUM and performance data as of June 30, 2022 unless noted otherwise. Not a comprehensive list of all Apollo funds and were chosen on the basis of illustrative mandates across the platform. There can be no guarantee or assurance that similar opportunities will become available, particularly on a
direct basis, in the future or if available, that such opportunities will achieve target returns once realized. Additional information available upon request. Past performance is not indicative of future results. Please refer to the slides at the end of this presentation for additional important information on performance,
including index performance. IRR calculations based on Apollo calculations, not an industry standard. 1. Peers represent a weighted average of AEL, AFG, LNC, MassMutual, MET, PRU, and PFG for the 5 years 2017 to 2021. Source: SNL Financial, Company Filings. Net asset yield calculated based on average statutory
investment yield on bonds and mortgages disclosed in annual U.S. life insurance statutory fillings. Statutory investment yield reduced for each company's respective investment fees and expenses approximated by taking annual GAAP investment expenses divided by average GAAP invested assets. Athene's statutory
investment yield was adjusted to include assets in Bermuda entities and separate accounts backing pension group annuities, and to back out the impact of the larger Lincoln and Jackson National block trades during their respective 12 months deployment periods. 2. Benchmark Capital funds with 2018 vintages net
IRR through Q1 2022. Represents total U.S. Credit Opportunities, Senior Debt and Subordinated Capital funds with 2018 vintages net IRR through Q4 2022. Reflects latest data available. 3. Reflects composite returns of Accord Fund I, Accord Fund II, Accord Fund III, Accord Fund III B and Accord Fund IV from the date
of the funding of Accord Fund I's first call in February 2017 through June 30, 2022. 4. Benchmark provided by Cambridge Associates, as of Q1 2022. Represents total U.S. Credit Opportunities, Senior Debt, Subordinated Capital and Buyout funds with 2018 vintages net IRR through Q4 2021. Reflects latest data
available. 5. Performance represents HVF I performance whereas the capital represents HVF strategy capital 6. Benchmark provided by Cambridge Associates, as of Q1 2022. Represents total U.S. Buyout funds with comparable vintages net IRR through Q1 2022. Reflects latest data available. 7. Flagship PE represents
Funds I-IX. Strategy AUM includes co-invest.
11View entire presentation