Solar Industry Update
FERC Issues Order 2023
Background
•
Bottlenecks in interconnection queues are holding up
1,700 GW of clean power in the United States (mostly
solar and batteries).
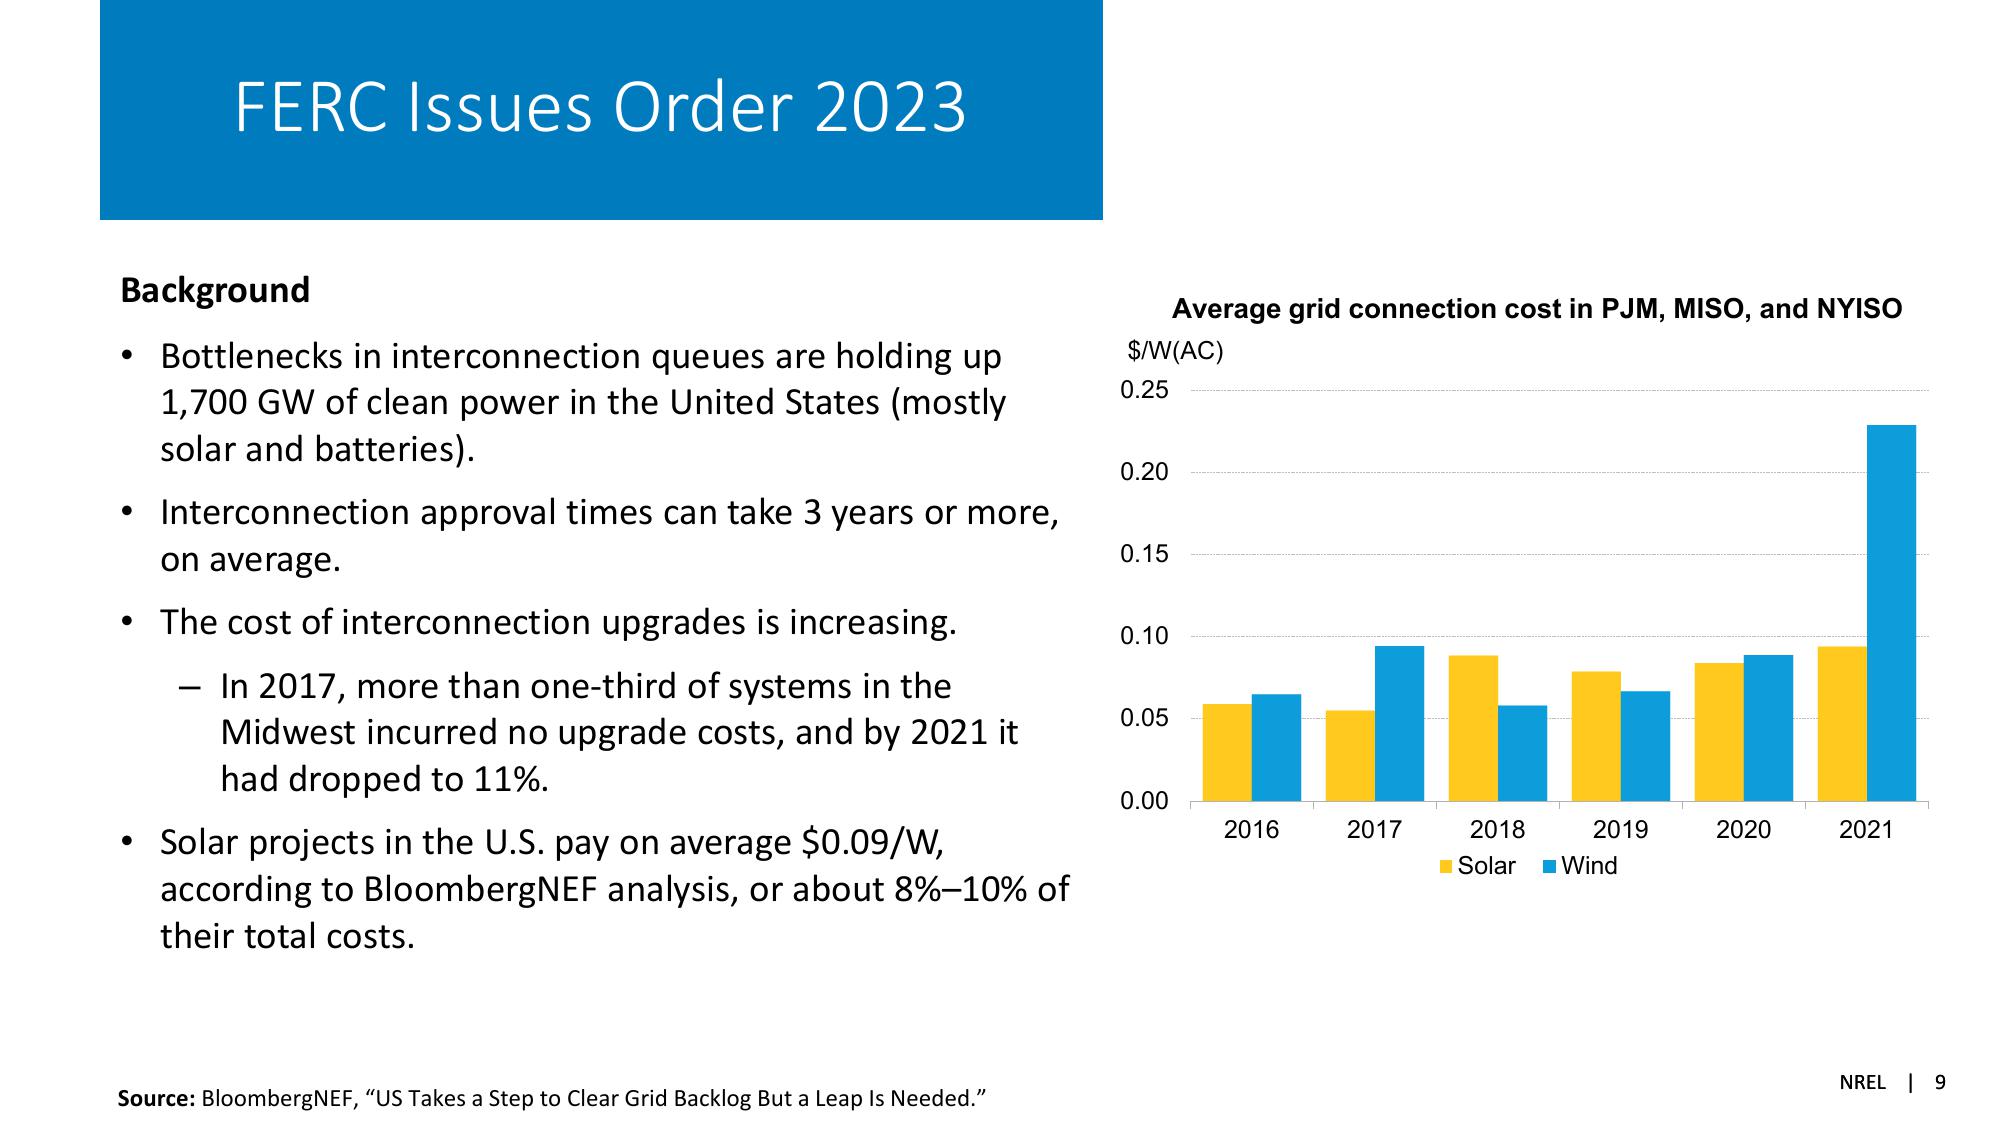
Average grid connection cost in PJM, MISO, and NYISO
$/W(AC)
0.25
0.20
• Interconnection approval times can take 3 years or more,
on average.
0.15
• The cost of interconnection upgrades is increasing.
0.10
In 2017, more than one-third of systems in the
Midwest incurred no upgrade costs, and by 2021 it
had dropped to 11%.
• Solar projects in the U.S. pay on average $0.09/W,
according to BloombergNEF analysis, or about 8%-10% of
their total costs.
Source: BloombergNEF, "US Takes a Step to Clear Grid Backlog But a Leap Is Needed."
0.05
0.00
2016
2017
2018
■Solar
2019
2020
2021
■Wind
NREL 9View entire presentation