Servicing Portfolio Growth Deck
SUMMARY 2Q'22 FINANCIAL RESULTS
$ mm's, except per share data
Servicing
Originations
Corporate debt interest expense
Corporate expense/other
Pretax operating income from continuing
operations (1)
Other mark-to-market
Sagent transaction
Title365 sale
Discontinued operations
Adjustments
Intangible amortization
Pretax income
Income tax expense
Net income
Weighted average diluted sharecount
Diluted EPS (2)
ROTCE(1)
Operating ROTCE (1) (3)
13 |
(2) Per share data calculated based on net income (loss) attributable to common shareholders
(1) Please see appendix for reconciliations of non-GAAP items
2Q¹22
$30
63
(39)
(37)
$17
196
(7)
(1)
$205
(54)
$151
74.3
$2.03
15.6%
1.3%
1Q'22
$7
157
(39)
(29)
$96
552
223
(3)
(2)
$866
(208)
$658
76.6
$8.59
74.4%
8.2%
2Q¹21
$80
213
(30)
(36)
$227
(135)
485
16
(7)
(3)
$583
(144)
$439
89.6
$4.85
58.9%
23.1%
●
●
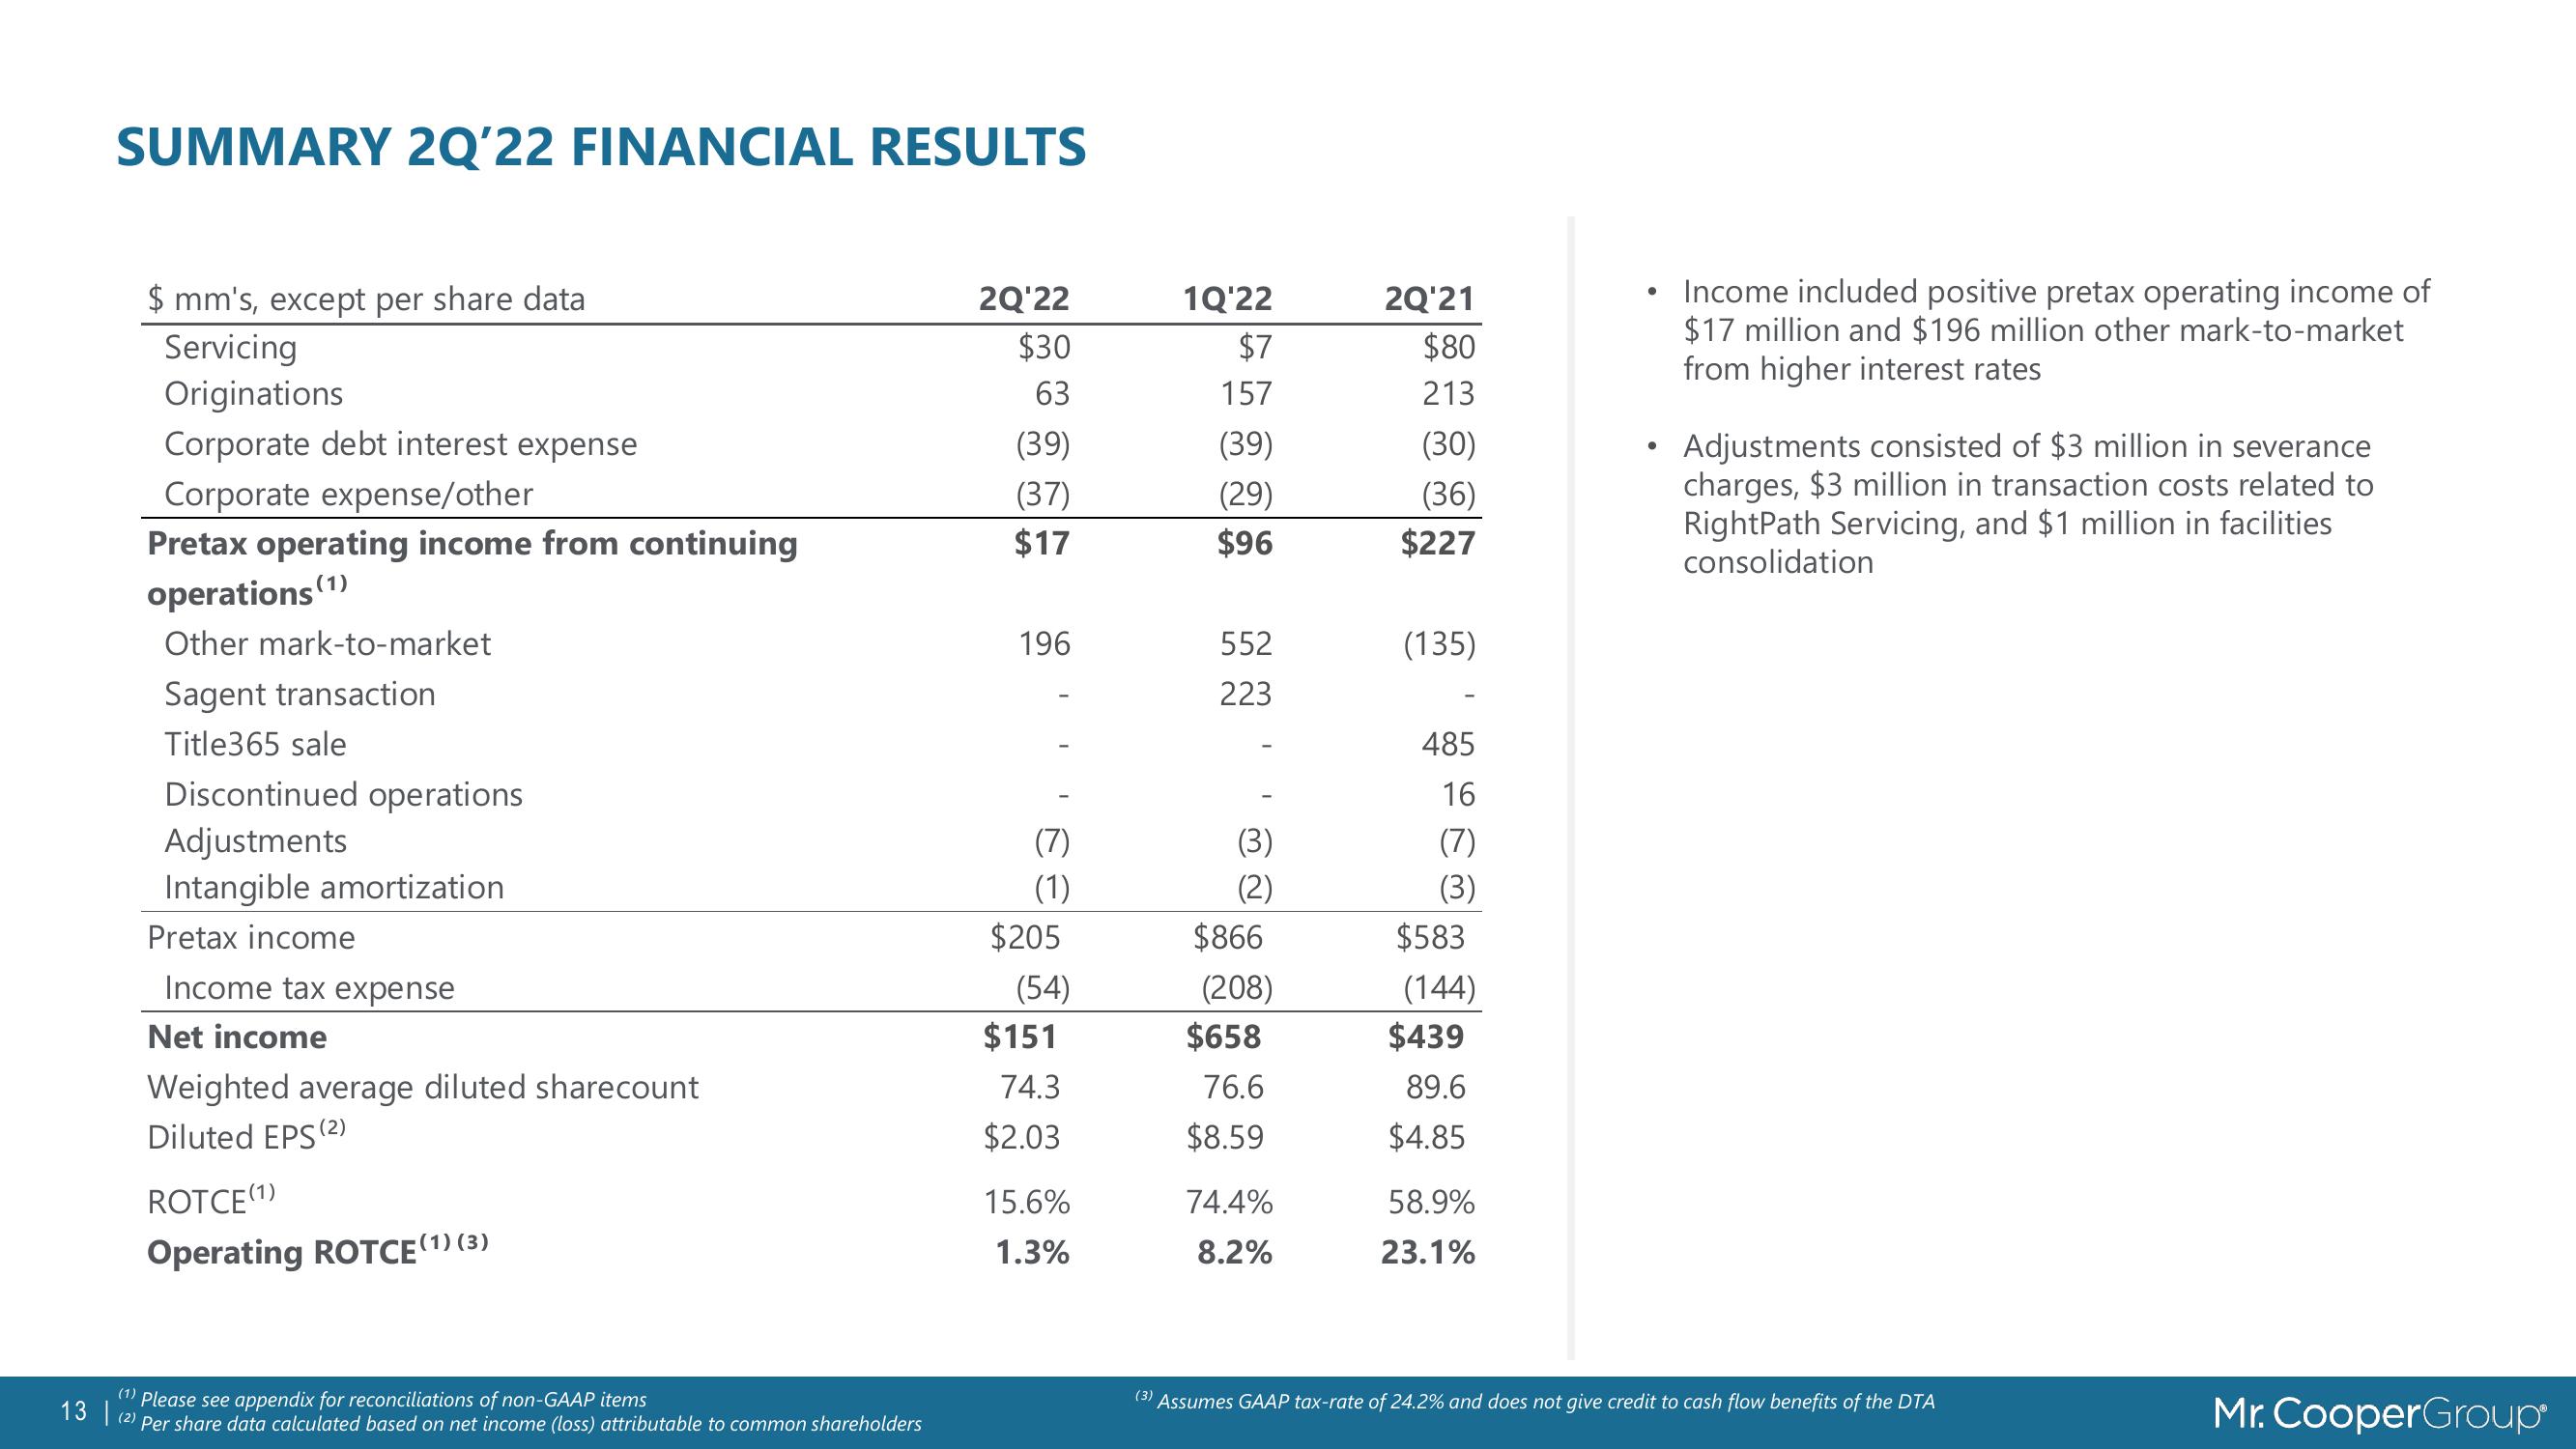
Income included positive pretax operating income of
$17 million and $196 million other mark-to-market
from higher interest rates
Adjustments consisted of $3 million in severance
charges, $3 million in transaction costs related to
RightPath Servicing, and $1 million in facilities
consolidation
(3) Assumes GAAP tax-rate of 24.2% and does not give credit to cash flow benefits of the DTA
Mr. CooperGroupView entire presentation