First Merchants Investor Presentation Deck
Non-GAAP
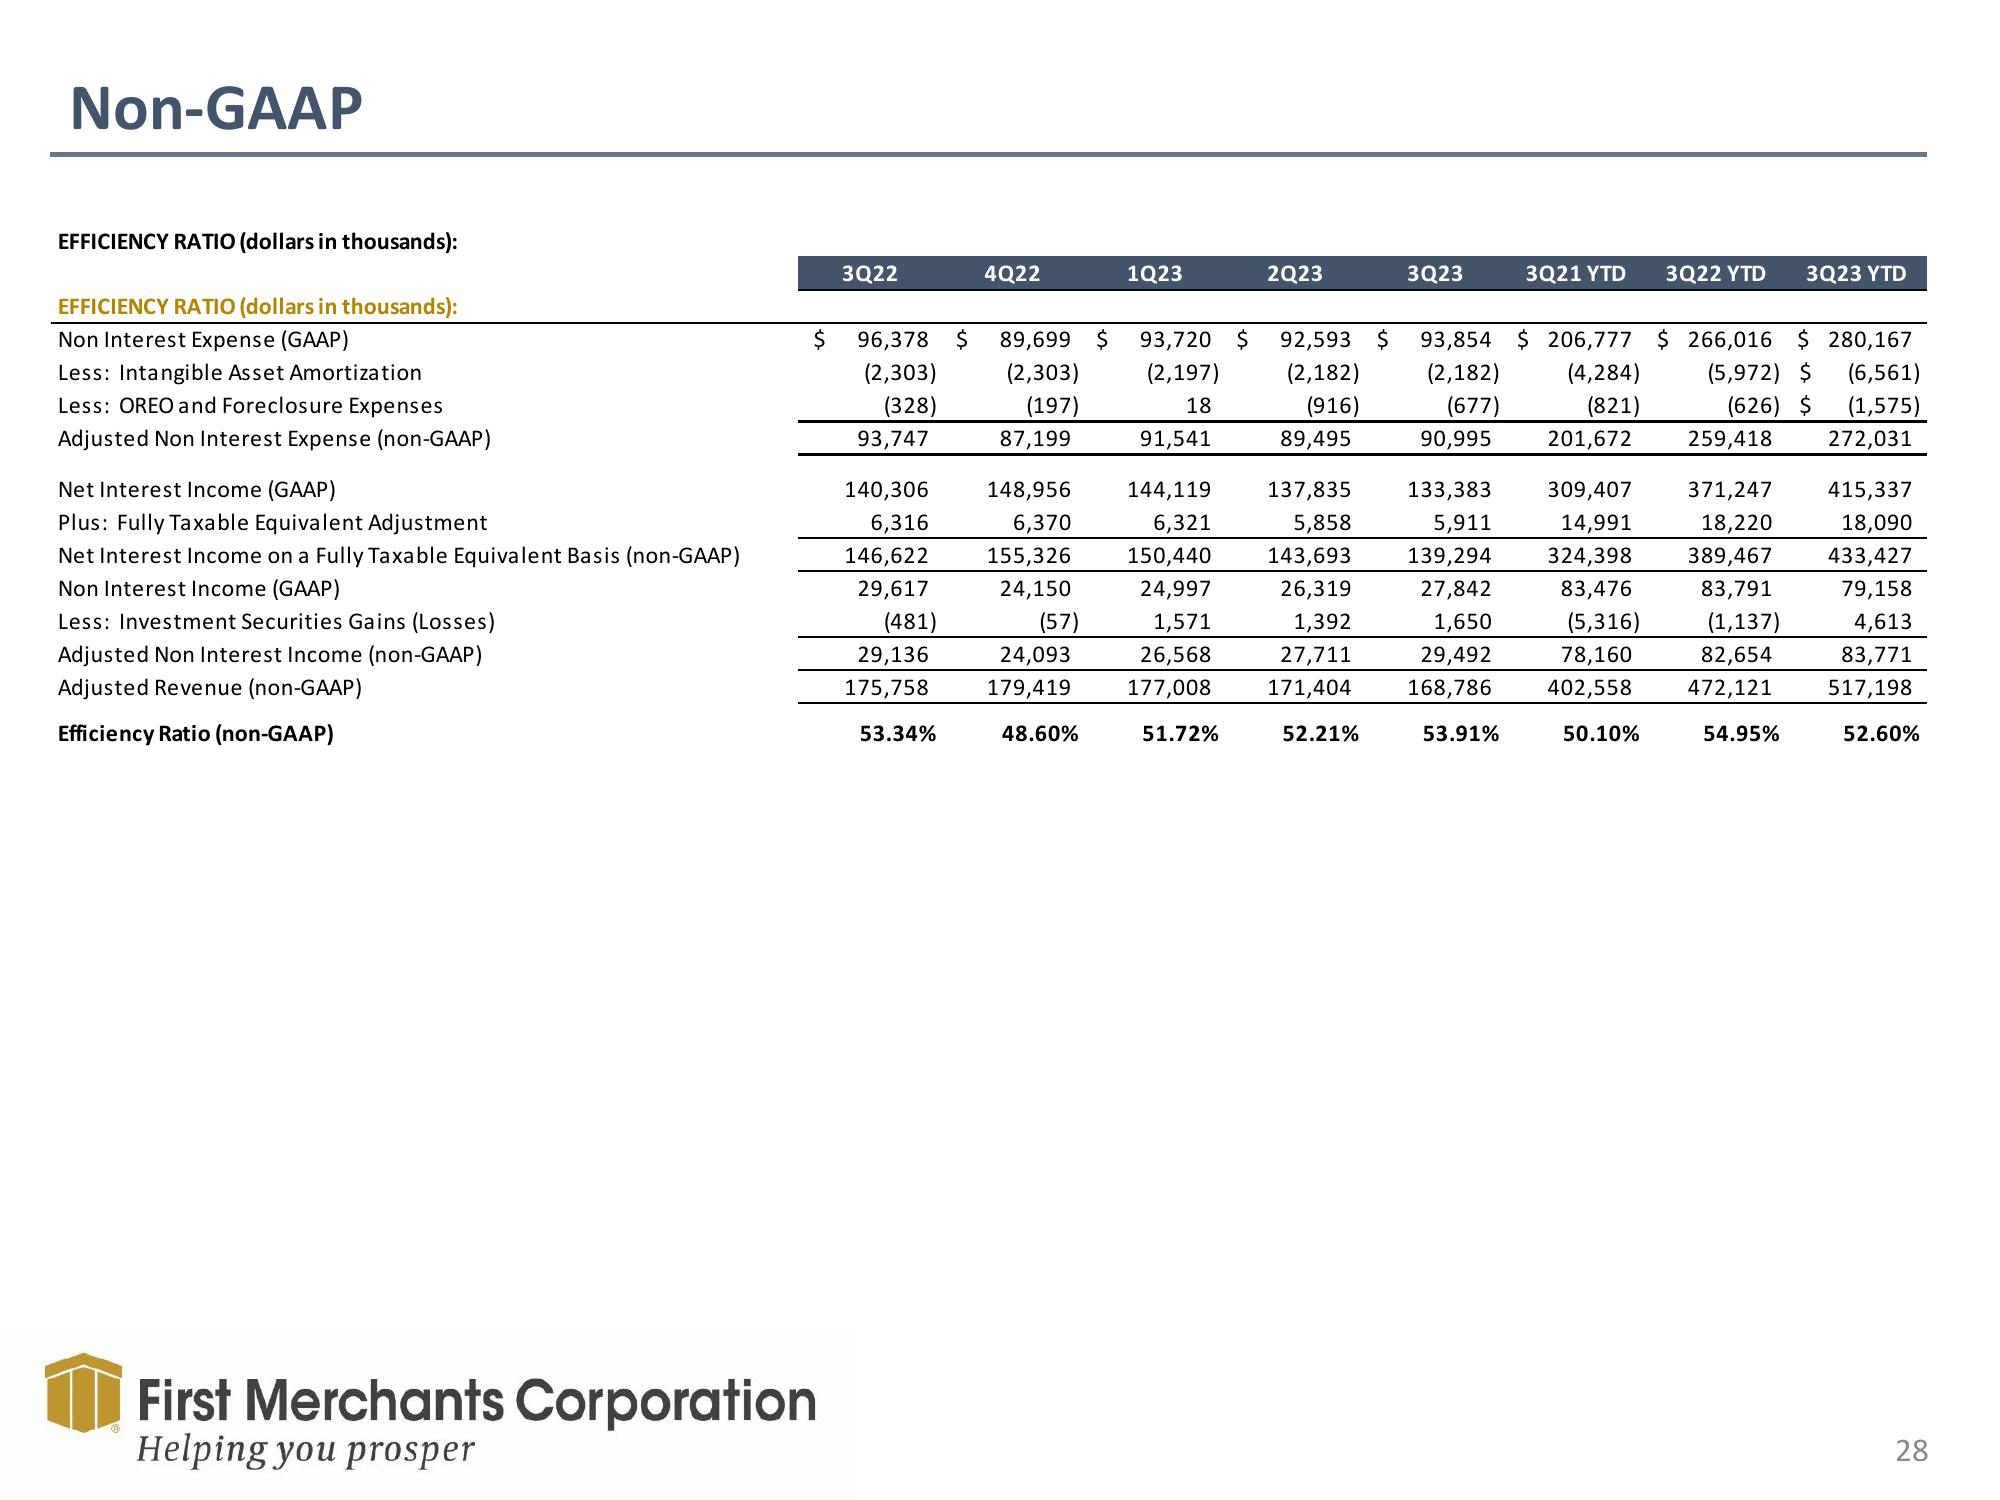
EFFICIENCY RATIO (dollars in thousands):
EFFICIENCY RATIO (dollars in thousands):
Non Interest Expense (GAAP)
Less: Intangible Asset Amortization
Less: OREO and Foreclosure Expenses
Adjusted Non Interest Expense (non-GAAP)
Net Interest Income (GAAP)
Plus: Fully Taxable Equivalent Adjustment
Net Interest Income on a Fully Taxable Equivalent Basis (non-GAAP)
Non Interest Income (GAAP)
Less: Investment Securities Gains (Losses)
Adjusted Non Interest Income (non-GAAP)
Adjusted Revenue (non-GAAP)
Efficiency Ratio (non-GAAP)
$
First Merchants Corporation
Helping you prosper
3Q22
96,378
(2,303)
(328)
93,747
140,306
6,316
146,622
29,617
(481)
29,136
175,758
53.34%
$
4Q22
148,956
6,370
155,326
24,150
(57)
89,699 $ 93,720 $ 92,593 $
(2,303)
(197)
(2,197)
18
91,541
87,199
(2,182)
(916)
89,495
137,835
5,858
143,693
26,319
1,392
27,711
171,404
52.21%
24,093
179,419
1Q23
48.60%
2Q23
144,119
6,321
150,440
24,997
1,571
26,568
177,008
51.72%
3Q23
3Q21 YTD
3Q22 YTD
93,854 $206,777 $ 266,016
(2,182) (4,284)
(677)
(821)
90,995 201,672
133,383
5,911
309,407
14,991
324,398
139,294
27,842
83,476
1,650
(5,316)
29,492
78,160
168,786 402,558
53.91%
50.10%
259,418
3Q23 YTD
(5,972) $
(626) $
371,247
18,220
389,467
83,791
(1,137)
82,654
472,121
54.95%
$ 280,167
(6,561)
(1,575)
272,031
415,337
18,090
433,427
79,158
4,613
83,771
517,198
52.60%
28View entire presentation