Truist Financial Corp Results Presentation Deck
3Q22 performance highlights
GAAP/Unadjusted
Summary Income Statement ($ MM)
Revenue
Expense
PPNR
Provision for credit losses
Net income available to common
Diluted EPS
ROTCE
Efficiency ratio
Adjusted
Revenue
Expense
PPNR
Net income available to common
Diluted EPS
ROTCE
Efficiency ratio
3Q22
$5,885
$3,613
$2,272
$234
$1,536
$1.15
23.5%
61.8%
$5,886
$3,321
$2,565
$1,654
$1.24
25.1%
56.4%
Change vs.
2Q22
3.6%
0.9%
8.0%
36.8%
5.6%
5.5%
80 bps
(150) bps
3.6%
2.6%
4.9%
3.1%
3.3%
30 bps
(60) bps
3Q21
4.6%
(4.8)%
24.1%
NM
(5.0)%
(4.2)%
420 bps
(600) bps
4.6%
2.0%
8.3%
(13.8)%
(12.7)%
250 bps
(150) bps
Note: All data points are taxable-equivalent, where applicable; see non-GAAP reconciliations in the appendix
Commentary
Earnings and profitability
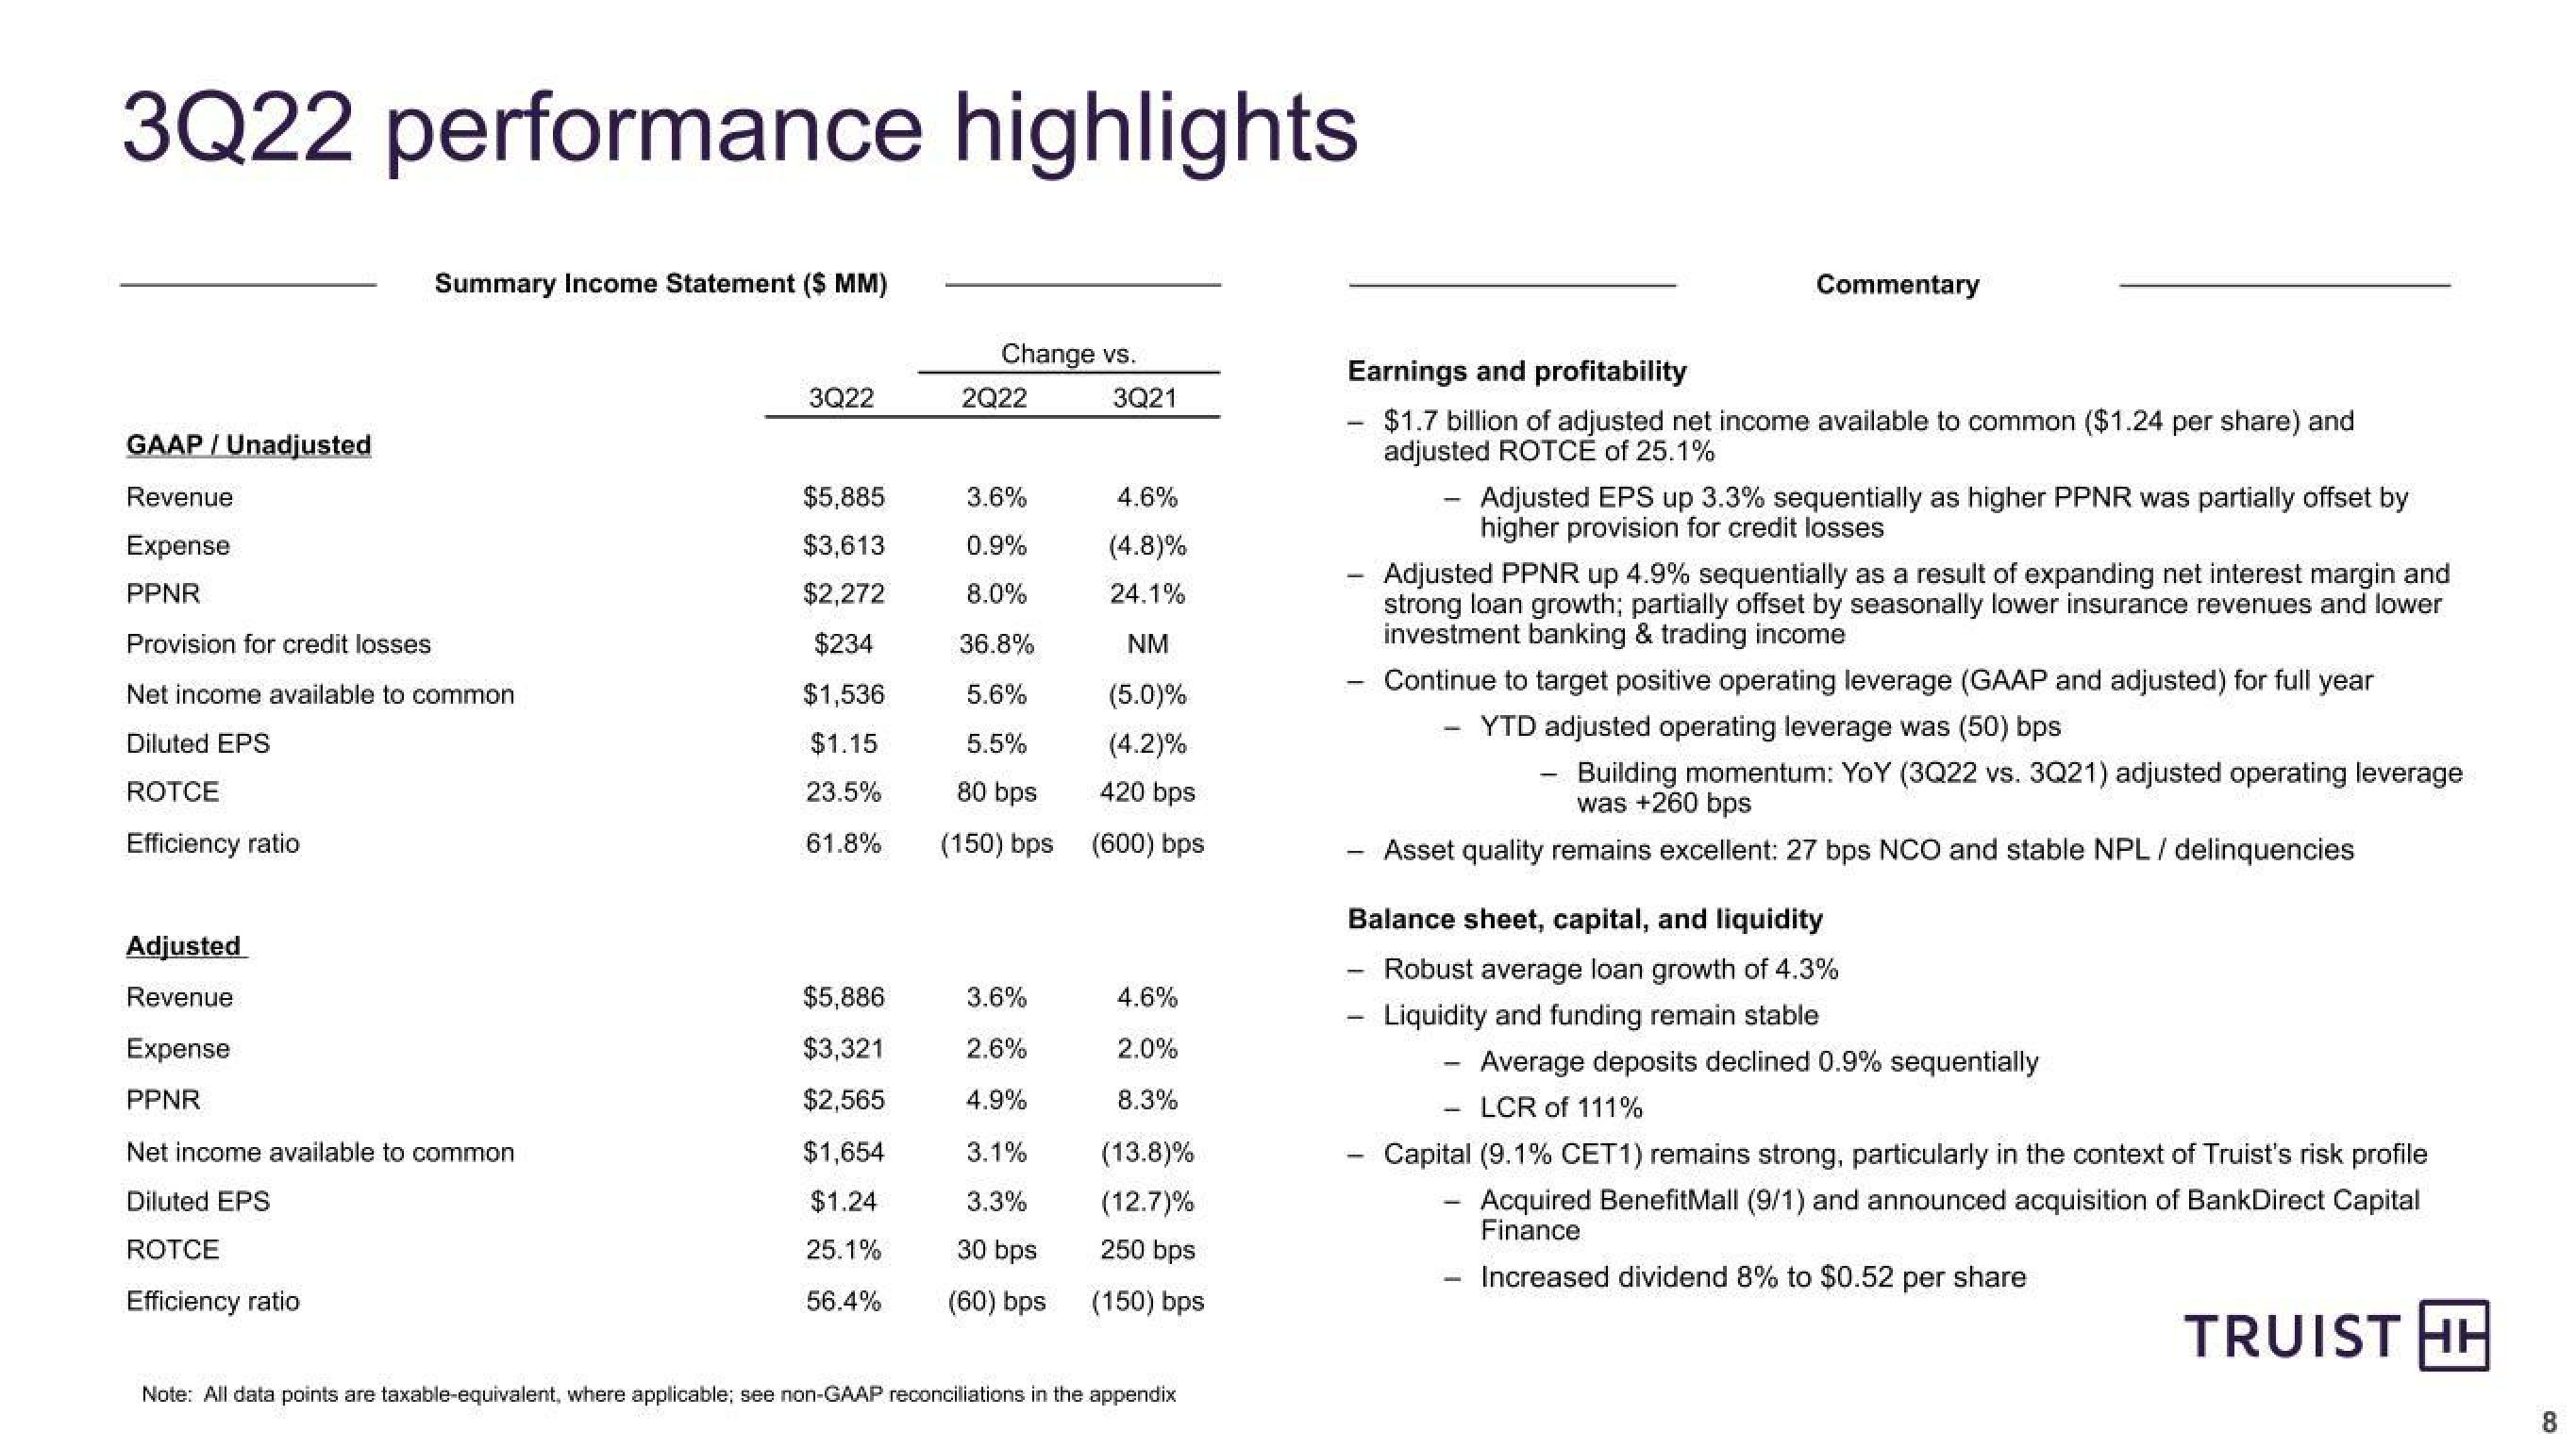
$1.7 billion of adjusted net income available to common ($1.24 per share) and
adjusted ROTCE of 25.1%
-
Adjusted EPS up 3.3% sequentially as higher PPNR was partially offset by
higher provision for credit losses
Adjusted PPNR up 4.9% sequentially as a result of expanding net interest margin and
strong loan growth; partially offset by seasonally lower insurance revenues and lower
investment banking & trading income
Continue to target positive operating leverage (GAAP and adjusted) for full year
YTD adjusted operating leverage was (50) bps
Building momentum: YoY (3Q22 vs. 3Q21) adjusted operating leverage
was +260 bps
Asset quality remains excellent: 27 bps NCO and stable NPL / delinquencies
Balance sheet, capital, and liquidity
Robust average loan growth of 4.3%
Liquidity and funding remain stable
Average deposits declined 0.9% sequentially
LCR of 111%
Capital (9.1% CET1) remains strong, particularly in the context of Truist's risk profile
Acquired BenefitMall (9/1) and announced acquisition of BankDirect Capital
Finance
Increased dividend 8% to $0.52 per share
TRUIST HH
8View entire presentation