Cameco IPO Presentation Deck
■
-
Westinghouse: Strong Financial Profile -
Long-Term Relationships
W Westinghouse
Operating Plant Services
13%
6%
Revenue Profile
Energy Systems
81%
Environmental Services
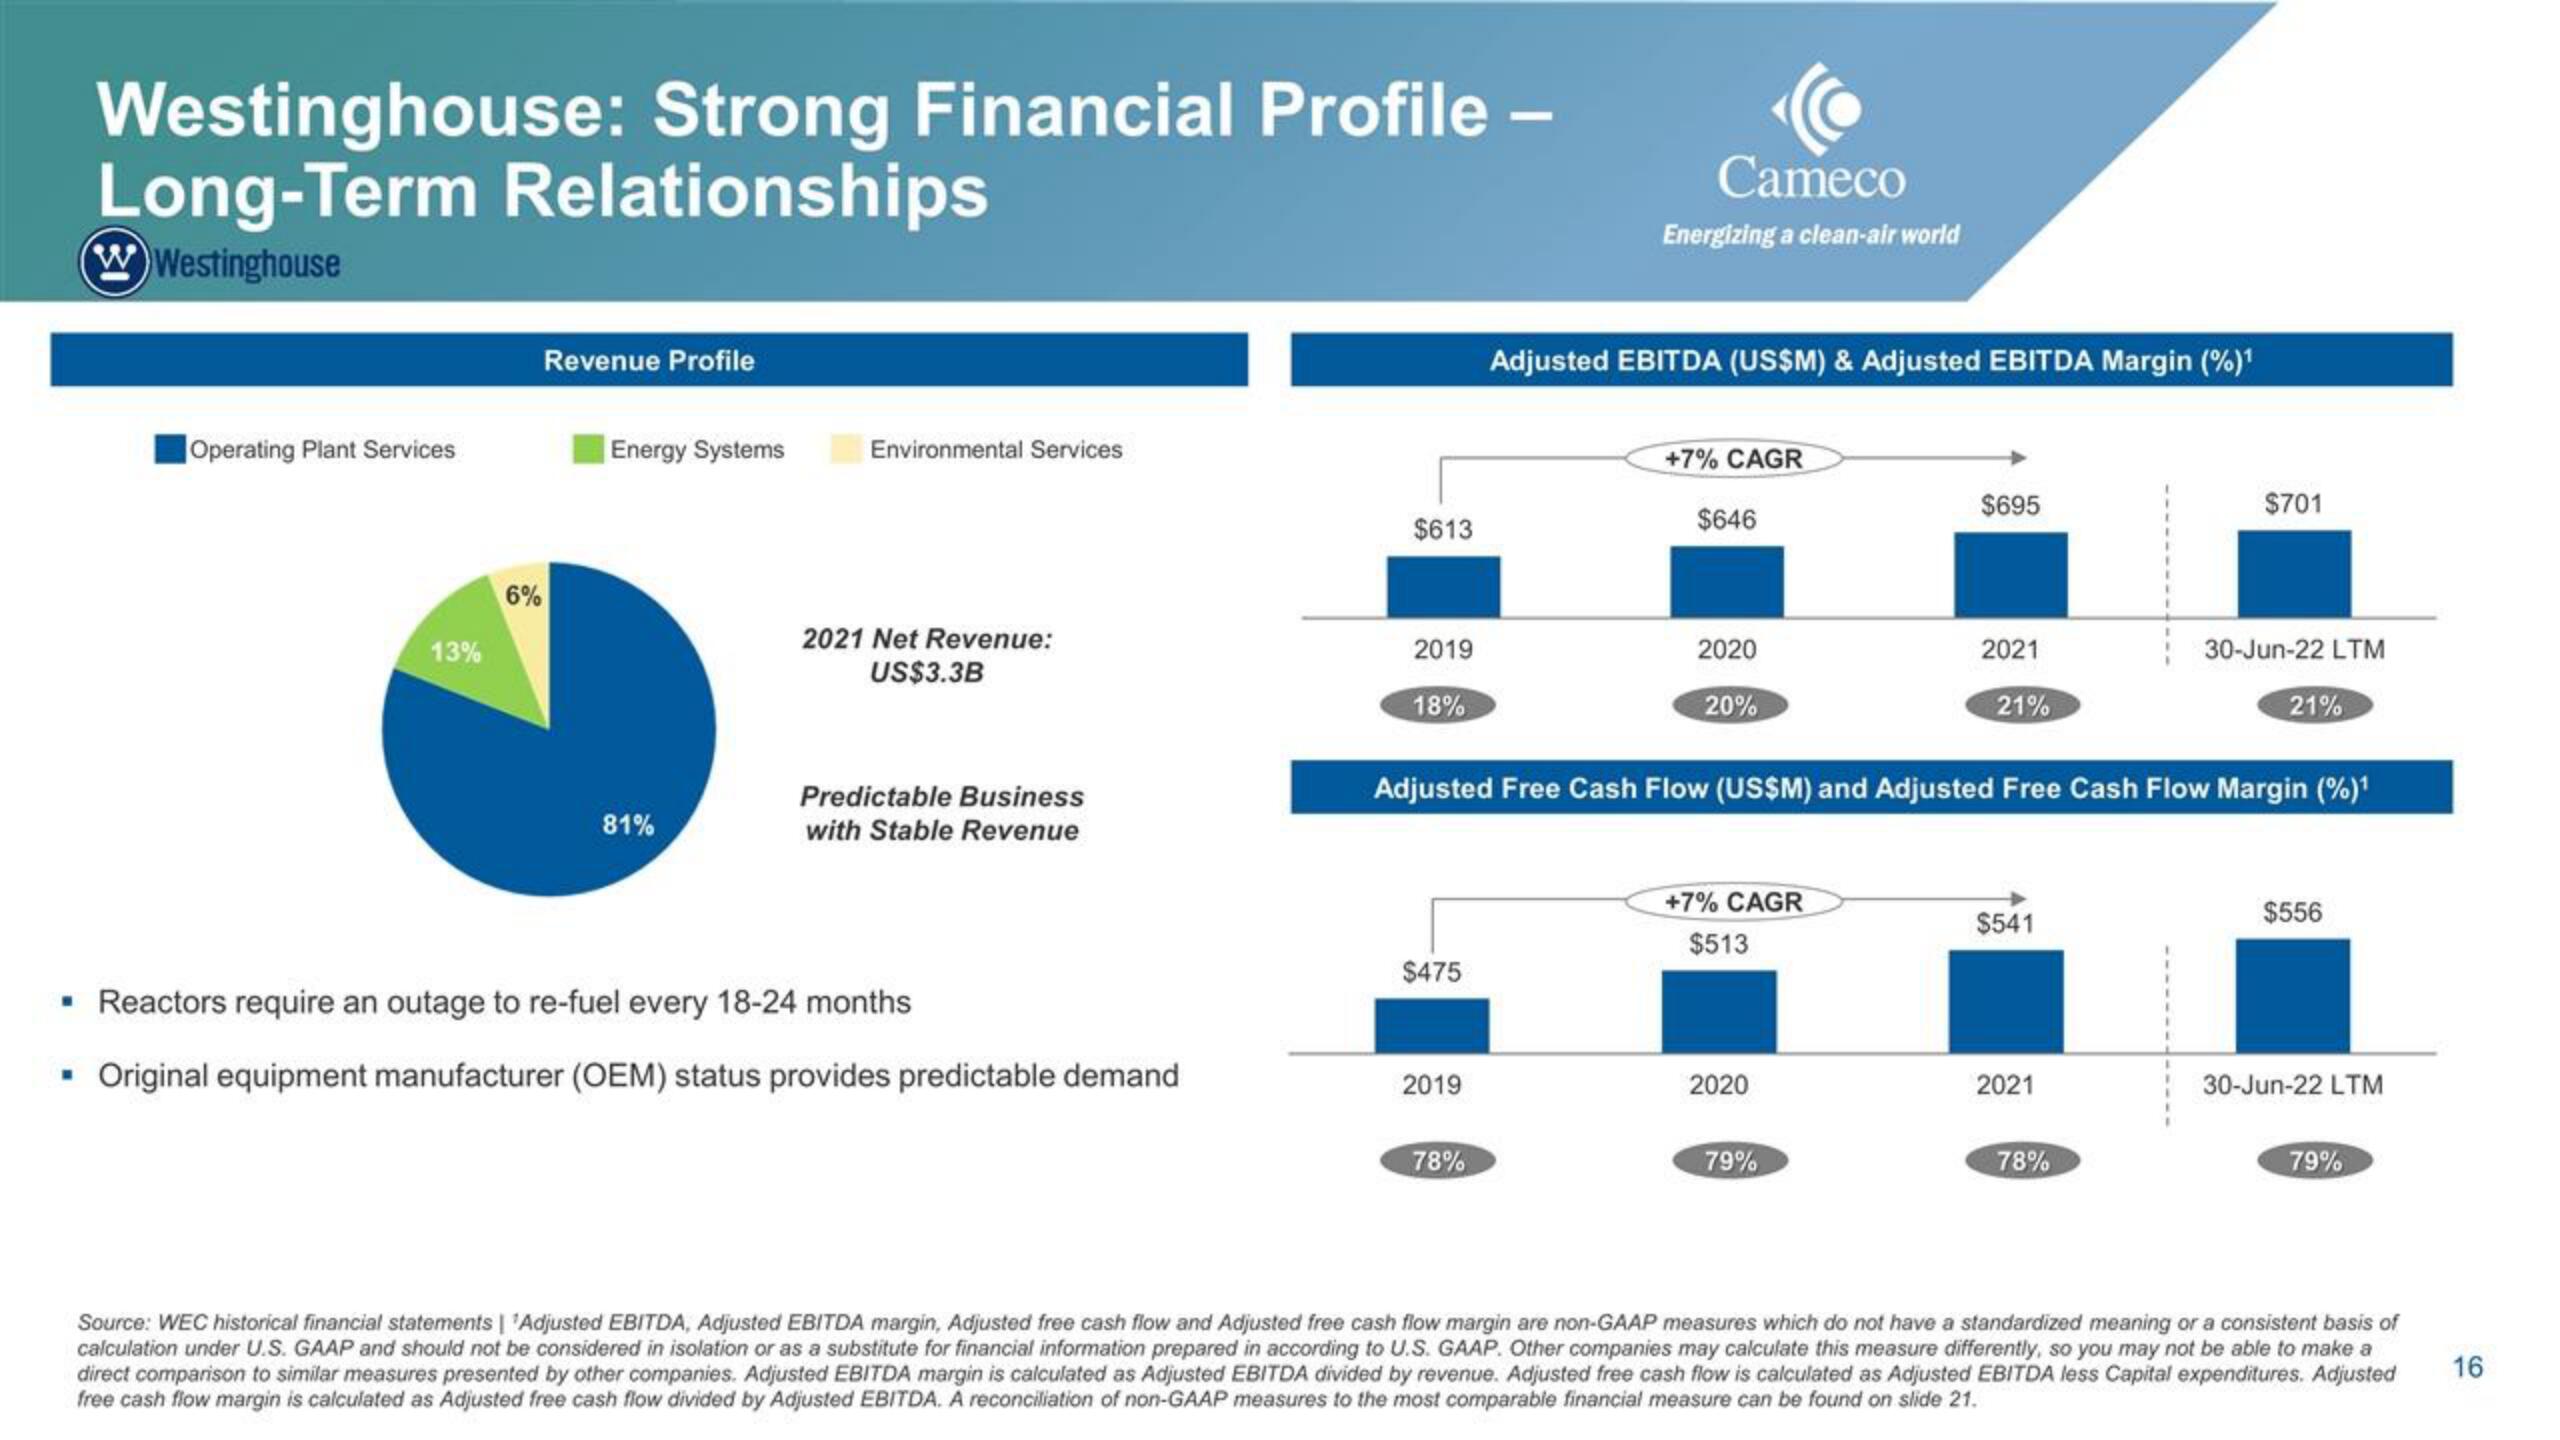
2021 Net Revenue:
US$3.3B
Predictable Business
with Stable Revenue
Reactors require an outage to re-fuel every 18-24 months
Original equipment manufacturer (OEM) status provides predictable demand
$613
2019
18%
$475
2019
Cameco
Energizing a clean-air world
78%
Adjusted EBITDA (US$M) & Adjusted EBITDA Margin (%)¹
+7% CAGR
$646
2020
20%
2021
21%
Adjusted Free Cash Flow (US$M) and Adjusted Free Cash Flow Margin (%)¹
+7% CAGR
$513
2020
$695
79%
$541
2021
$701
78%
30-Jun-22 LTM
21%
$556
30-Jun-22 LTM
79%
Source: WEC historical financial statements | Adjusted EBITDA, Adjusted EBITDA margin, Adjusted free cash flow and Adjusted free cash flow margin are non-GAAP measures which do not have a standardized meaning or a consistent basis of
calculation under U.S. GAAP and should not be considered in isolation or as a substitute for financial information prepared in according to U.S. GAAP. Other companies may calculate this measure differently, so you may not be able to make a
direct comparison to similar measures presented by other companies. Adjusted EBITDA margin is calculated as Adjusted EBITDA divided by revenue. Adjusted free cash flow is calculated as Adjusted EBITDA less Capital expenditures. Adjusted
free cash flow margin is calculated as Adjusted free cash flow divided by Adjusted EBITDA. A reconciliation of non-GAAP measures to the most comparable financial measure can be found on slide 21.
16View entire presentation