Pathward Financial Results Presentation Deck
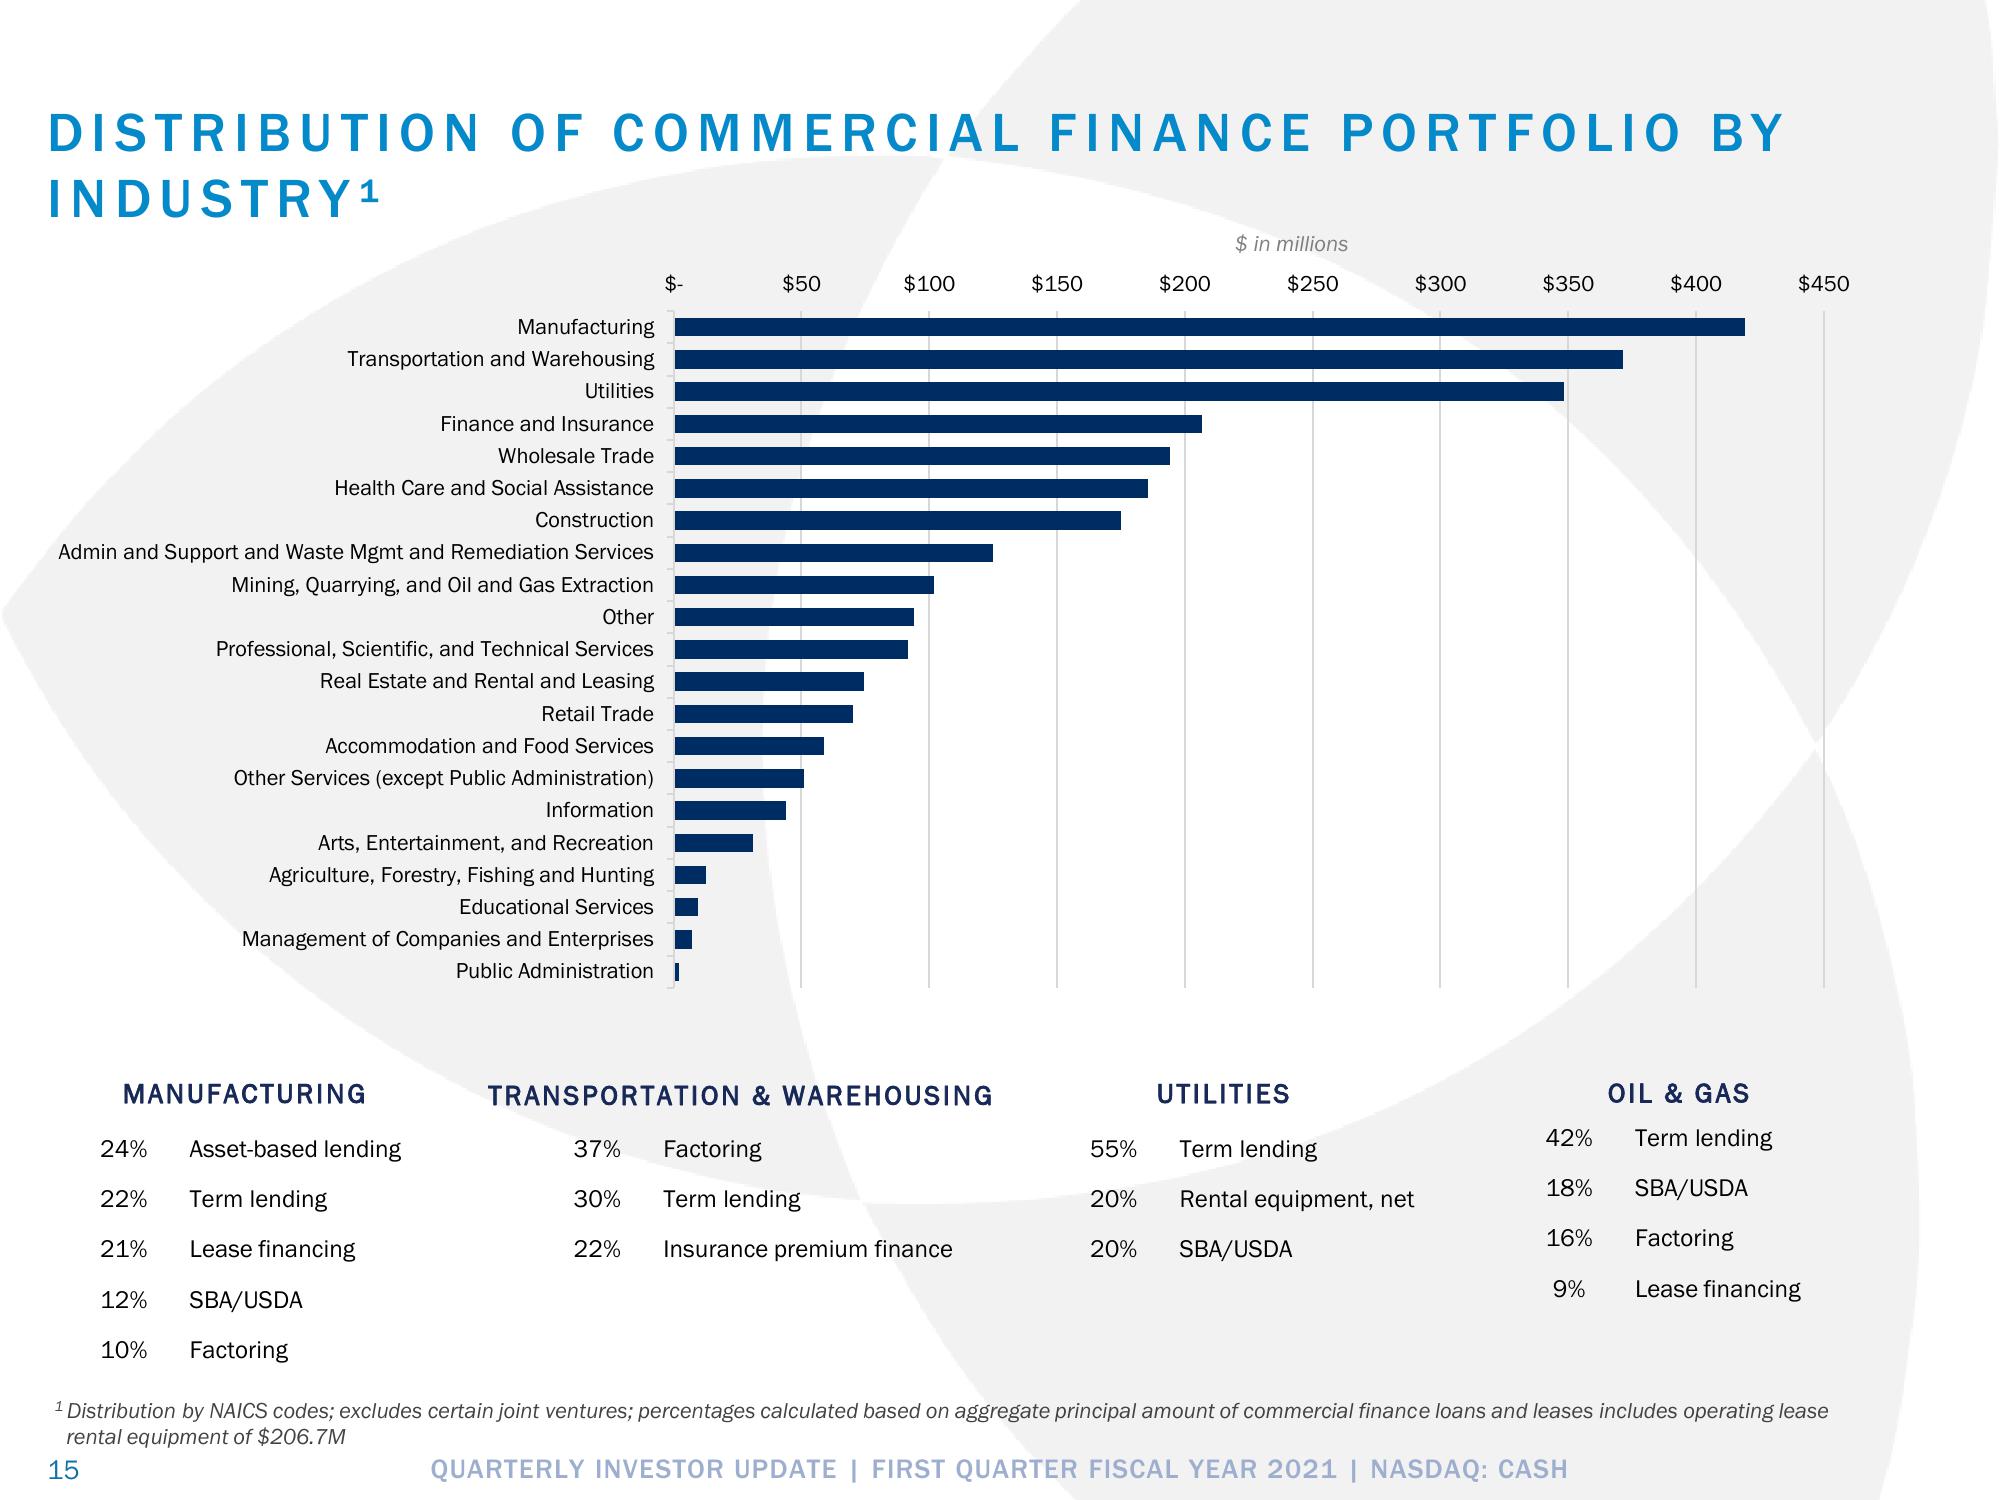
DISTRIBUTION OF COMMERCIAL FINANCE PORTFOLIO BY
INDUSTRY ¹
Manufacturing
Transportation and Warehousing
24%
MANUFACTURING
Health Care and Social Assistance
Construction
Admin and Support and Waste Mgmt and Remediation Services
Mining, Quarrying, and Oil and Gas Extraction
Other
Professional, Scientific, and Technical Services
Real Estate and Rental and Leasing
Retail Trade
Accommodation and Food Services
Other Services (except Public Administration)
Information
Arts, Entertainment, and Recreation
Agriculture, Forestry, Fishing and Hunting
Educational Services
Management of Companies and Enterprises
Public Administration I
22%
Utilities
Finance and Insurance
Wholesale Trade
Asset-based lending
Term lending
21% Lease financing
12% SBA/USDA
10%
Factoring
$-
37%
30%
22%
...
$50
TRANSPORTATION & WAREHOUSING
$100
Factoring
Term lending
Insurance premium finance
$150
55%
20%
20%
$200
$ in millions
$250
$300
UTILITIES
Term lending
Rental equipment, net
SBA/USDA
$350
42%
18%
16%
9%
$400
OIL & GAS
Term lending
$450
SBA/USDA
Factoring
Lease financing
¹ Distribution by NAICS codes; excludes certain joint ventures; percentages calculated based on aggregate principal amount of commercial finance loans and leases includes operating lease
rental equipment of $206.7M
15
QUARTERLY INVESTOR UPDATE | FIRST QUARTER FISCAL YEAR 2021 | NASDAQ: CASHView entire presentation