Synchrony Financial Results Presentation Deck
Platform Results
Retail Card
Loan receivables, $ in billions
1Q'20
1Q'21
Payment Solutions
Loan receivables, $ in billions
1Q'20
1Q'21
CareCredit
Loan receivables, $ in billions
1Q'20
(a)
1Q'21
synchrony
(9)%
(1)%
$52.4
$47.9
(8)%
$20.0
$19.7
$10.1
$9.3
Purchase
volume
Accounts
Interest and
fees on loans
Purchase
volume
Accounts
Interest and
fees on loans
Purchase
volume
Accounts
Interest and
fees on loans
1Q'20
$23.9
53.0
$3,037
1Q'20
$5.4
12.7
$706
1Q'20
$2.7
6.4
$597
1Q'21
$26.5
49.1
$2,547
1Q'21
$5.6
11.5
$627
1Q'21
$2.6
5.7
$558
V%
11%
(7)%
(16)%
V%
3%
(9)%
(11)%
V%
(0)%
(11)%
(7)%
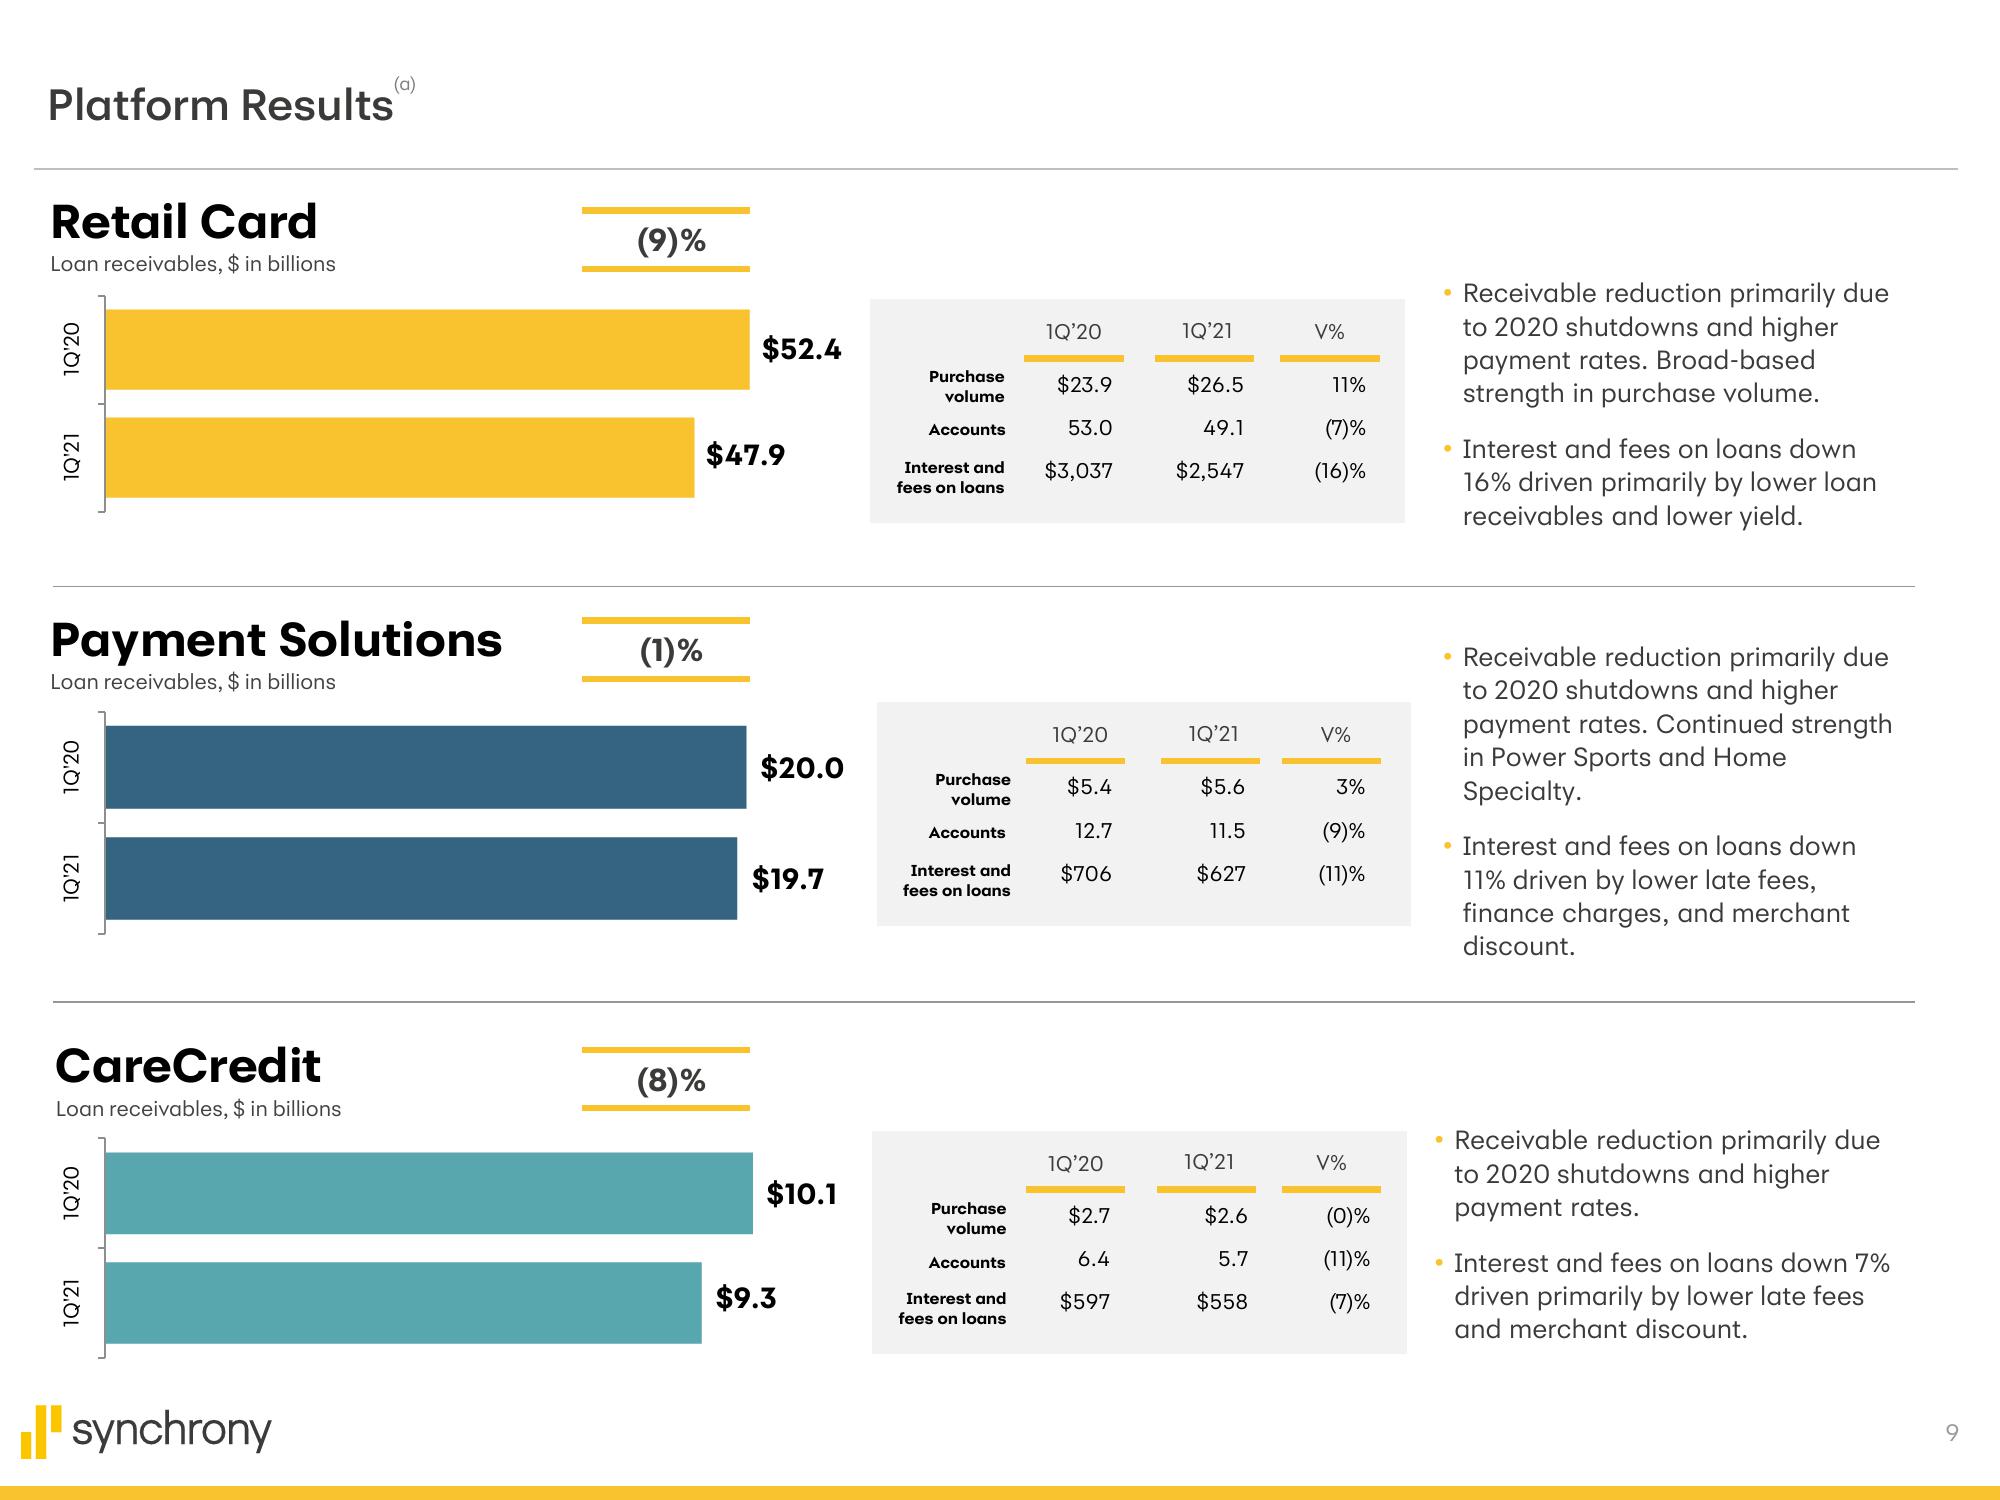
• Receivable reduction primarily due
to 2020 shutdowns and higher
payment rates. Broad-based
strength in purchase volume.
• Receivable reduction primarily due
to 2020 shutdowns and higher
payment rates. Continued strength
in Power Sports and Home
Specialty.
Interest and fees on loans down
16% driven primarily by lower loan
receivables and lower yield.
• Interest and fees on loans down
11% driven by lower late fees,
finance charges, and merchant
discount.
●
@
Receivable reduction primarily due
to 2020 shutdowns and higher
payment rates.
Interest and fees on loans down 7%
driven primarily by lower late fees
and merchant discount.
9View entire presentation