BlackSky SPAC Presentation Deck
($ in millions)
FY ending 12/31
Net Income (Loss) from Continuing Operations
(+) Depreciation
(+) Amortization
(+) Interest
(+) Taxes
(+) LeoStella Equity Method Entry and other
non-cash expenses
EBITDA
(+) Launch Division Gain / Loss (Disc. Ops, Net
(+) Shared Services and Bonuses)
(+) Other Gain / Loss (Debt and Unrealized)
(+) Satellite Impairment Loss
(+) Stock Compensation
Reconciliation of Non-GAAP Financials
Adj. EBITDA
(-) Capex
Free Cash Flow (FCF)¹
BLACK SKY
2019A
($66)
6
1
14
1
($44)
4
(1)
7
4
($31)
(34)
($65)
2020A
($20)
8
1
5
1
($4)
(28)
0
2
($29)
(18)
($47)
2021E
($272)
21
1
160
(0)
($90)
(0)
26
19
4
($41)
(95)
($136)
2022E
($99)
40
1
5
(2)
($54)
57
$2
(121)
($118)
2023E
($23)
52
1
8
$38
I
I
34
$72
(138)
($66)
2024E
$69
79
1
8
$157
21
$177
(66)
$111
2025E
$105²
77
1
1
38
$223
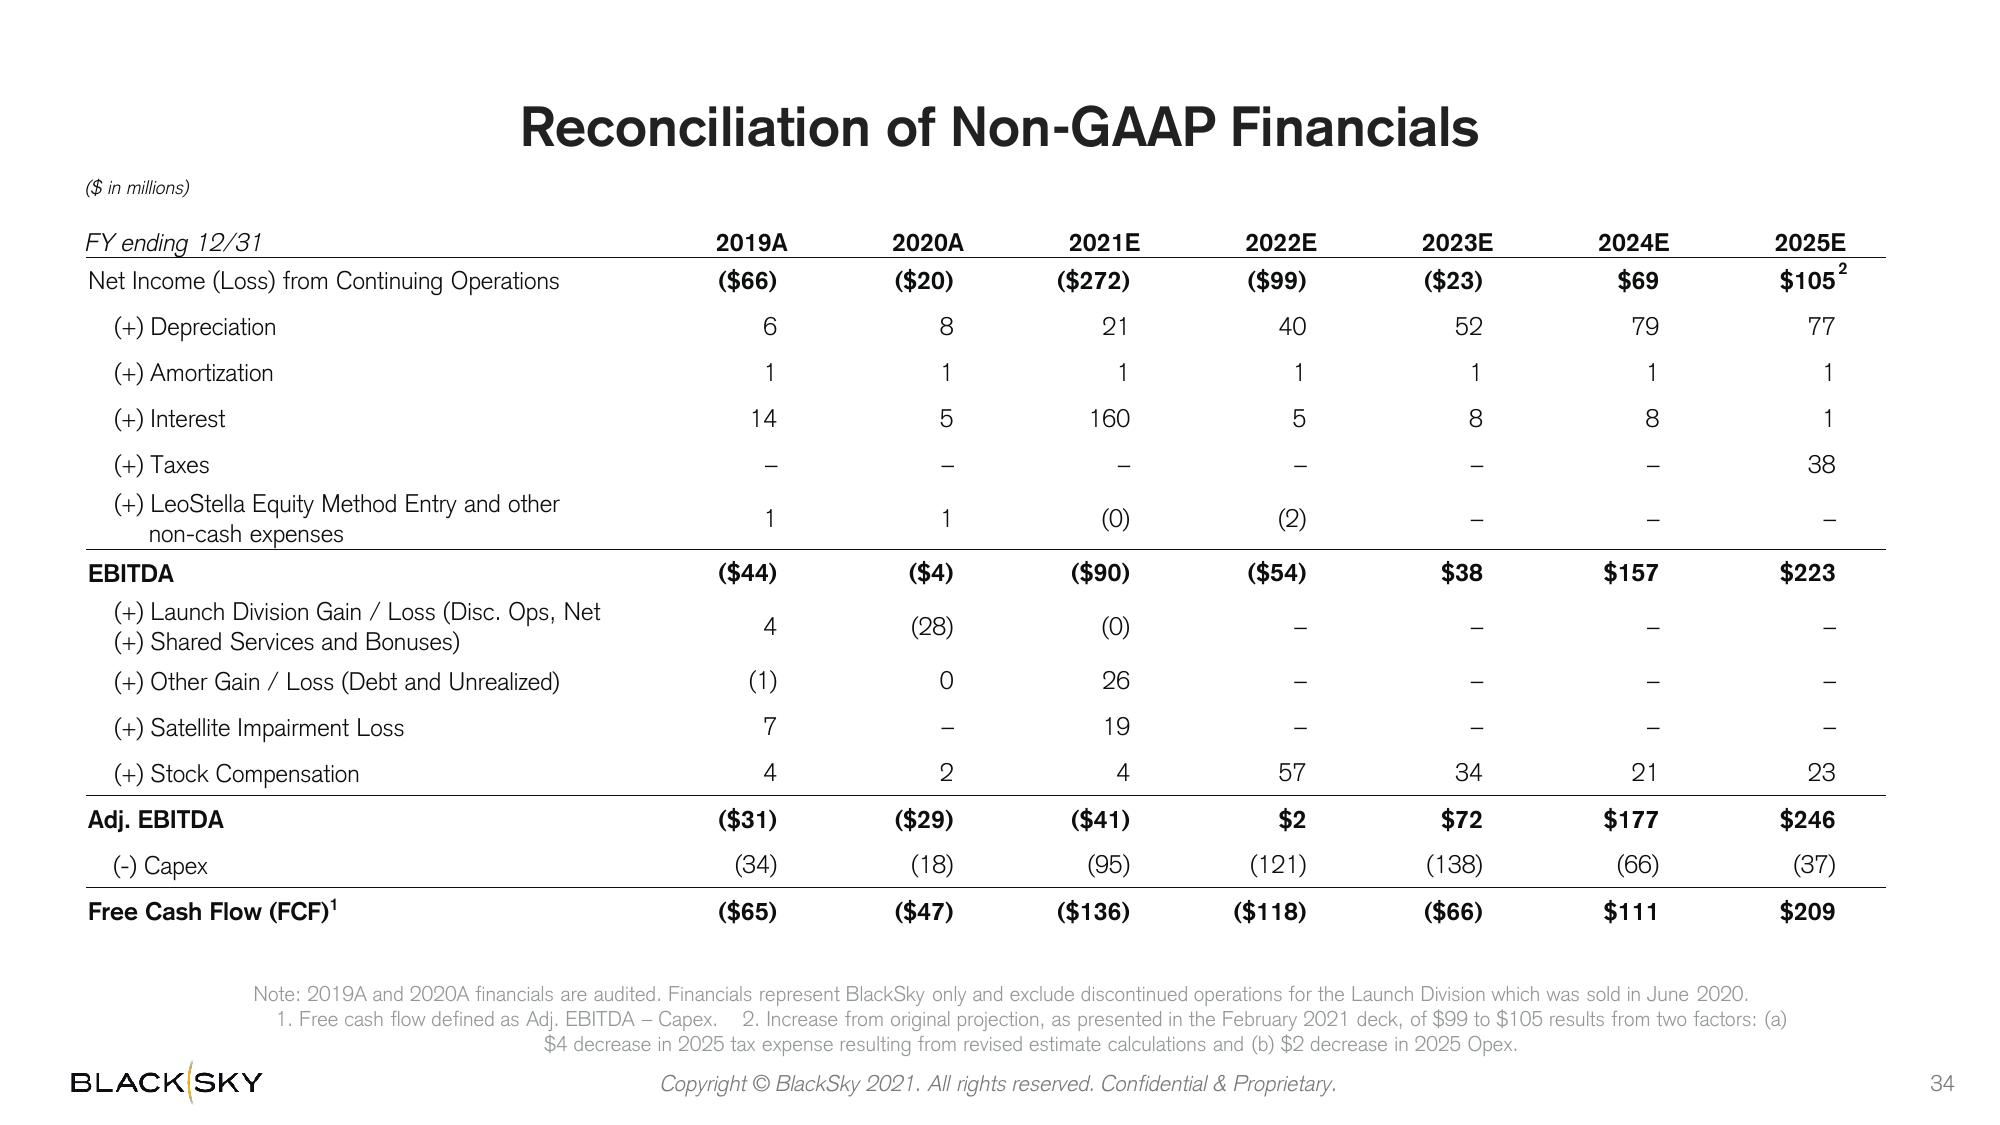
Note: 2019A and 2020A financials are audited. Financials represent BlackSky only and exclude discontinued operations for the Launch Division which was sold in June 2020.
1. Free cash flow defined as Adj. EBITDA - Capex. 2. Increase from original projection, as presented in the February 2021 deck, of $99 to $105 results from two factors: (a)
$4 decrease in 2025 tax expense resulting from revised estimate calculations and (b) $2 decrease in 2025 Opex.
Copyright © BlackSky 2021. All rights reserved. Confidential & Proprietary.
I
23
$246
(37)
$209
34View entire presentation