Keysight Technologies Q1 Fiscal Year 2023 Results
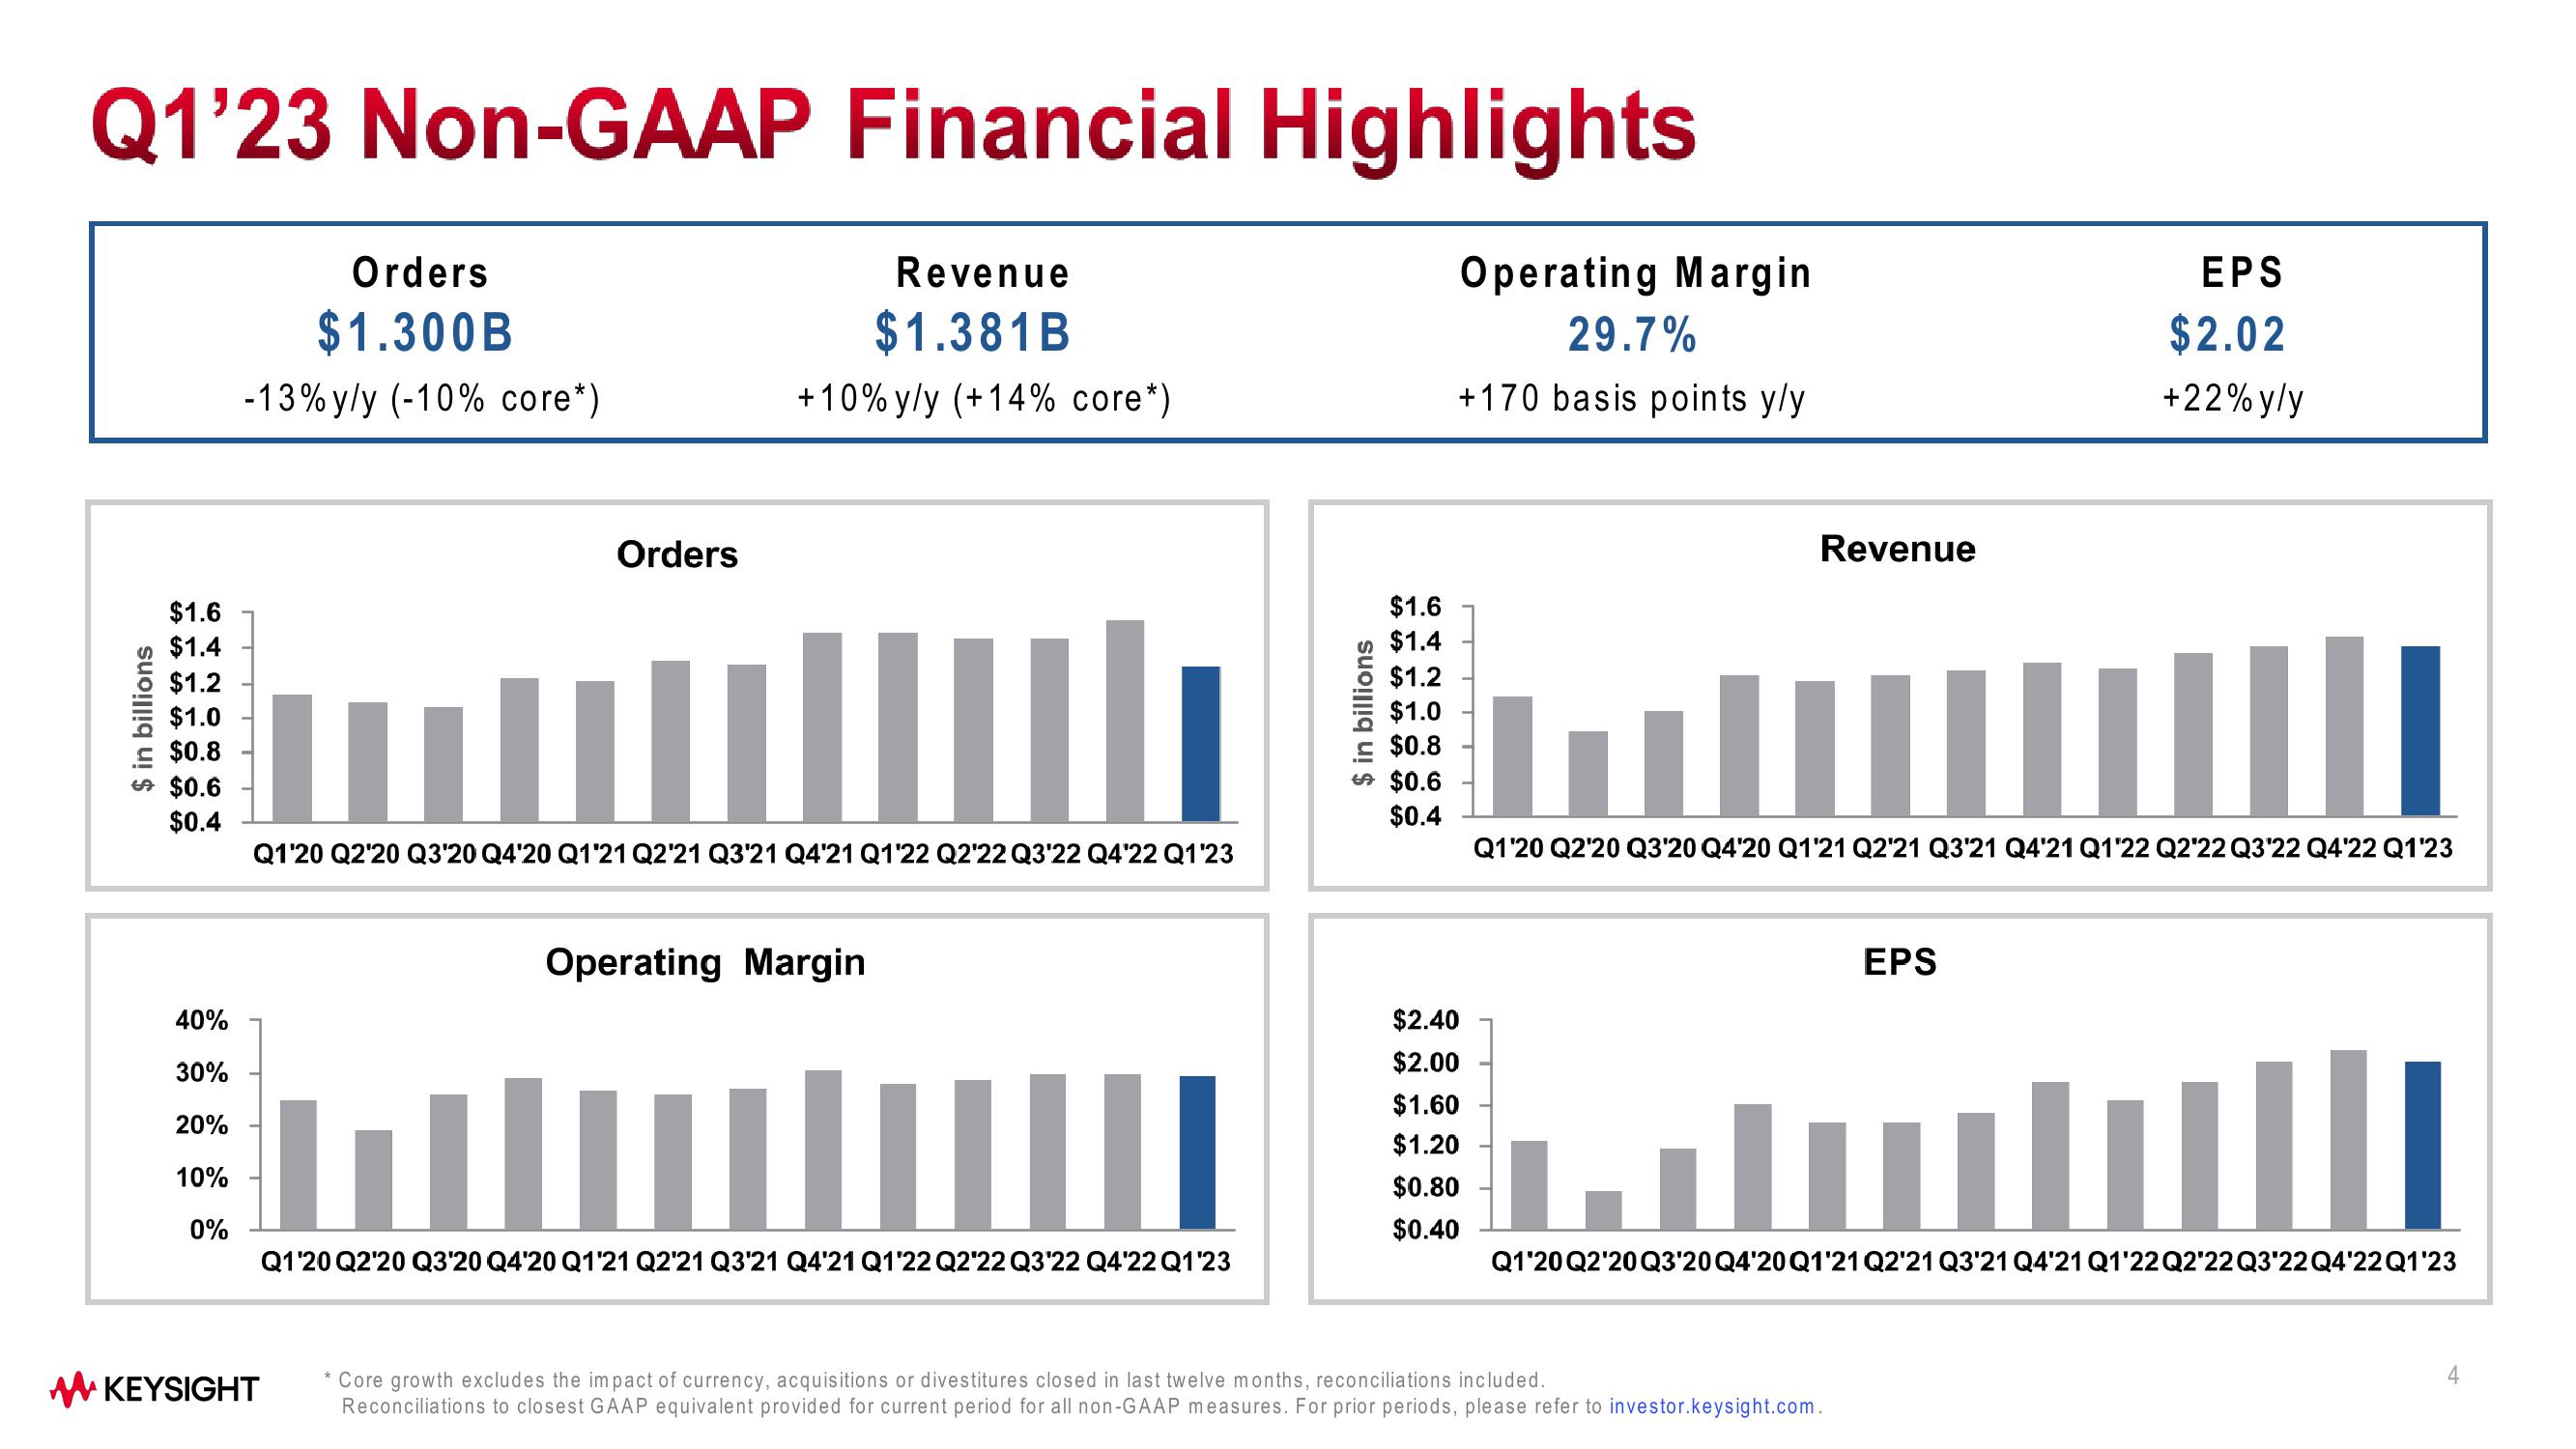
Q1'23 Non-GAAP Financial Highlights
Revenue
$1.381 B
Operating Margin
29.7%
+10% y/y (+14% core*)
+170 basis points y/y
$ in billions
$1.6
$1.4
$1.2
$1.0
$0.8
$0.6
$0.4
40%
30%
20%
10%
0%
Orders
$1.300B
-13% y/y (-10% core*)
Orders
Q1'20 Q2'20 Q3'20 Q4'20 Q1'21 Q2'21 Q3'21 Q4'21 Q1'22 Q2'22 Q3'22 Q4'22 Q1'23
✔KEYSIGHT
Operating Margin
1
Q1'20 Q2'20 Q3'20 Q4'20 Q1'21 Q2'21 Q3'21 Q4'21 Q1'22 Q2'22 Q3'22 Q4'22 Q1'23
$ in billions
$1.6
$1.4
$1.2
$1.0
$0.8
$0.6
$0.4
$2.40
$2.00
$1.60
$1.20
$0.80
$0.40
Revenue
Q1'20 Q2'20 Q3'20 Q4'20 Q1'21 Q2'21 Q3'21 Q4'21 Q1'22 Q2'22 Q3'22 Q4'22 Q1'23
EPS
$2.02
+22% y/y
EPS
* Core growth excludes the impact of currency, acquisitions or divestitures closed in last twelve months, reconciliations included.
Reconciliations to closest GAAP equivalent provided for current period for all non-GAAP measures. For prior periods, please refer to investor.keysight.com.
Q1'20Q2'20 Q3'20 Q4'20 Q1'21 Q2'21 Q3'21 Q4'21 Q1'22Q2'22 Q3'22 Q4'22Q1'23
4View entire presentation