Kore Results Presentation Deck
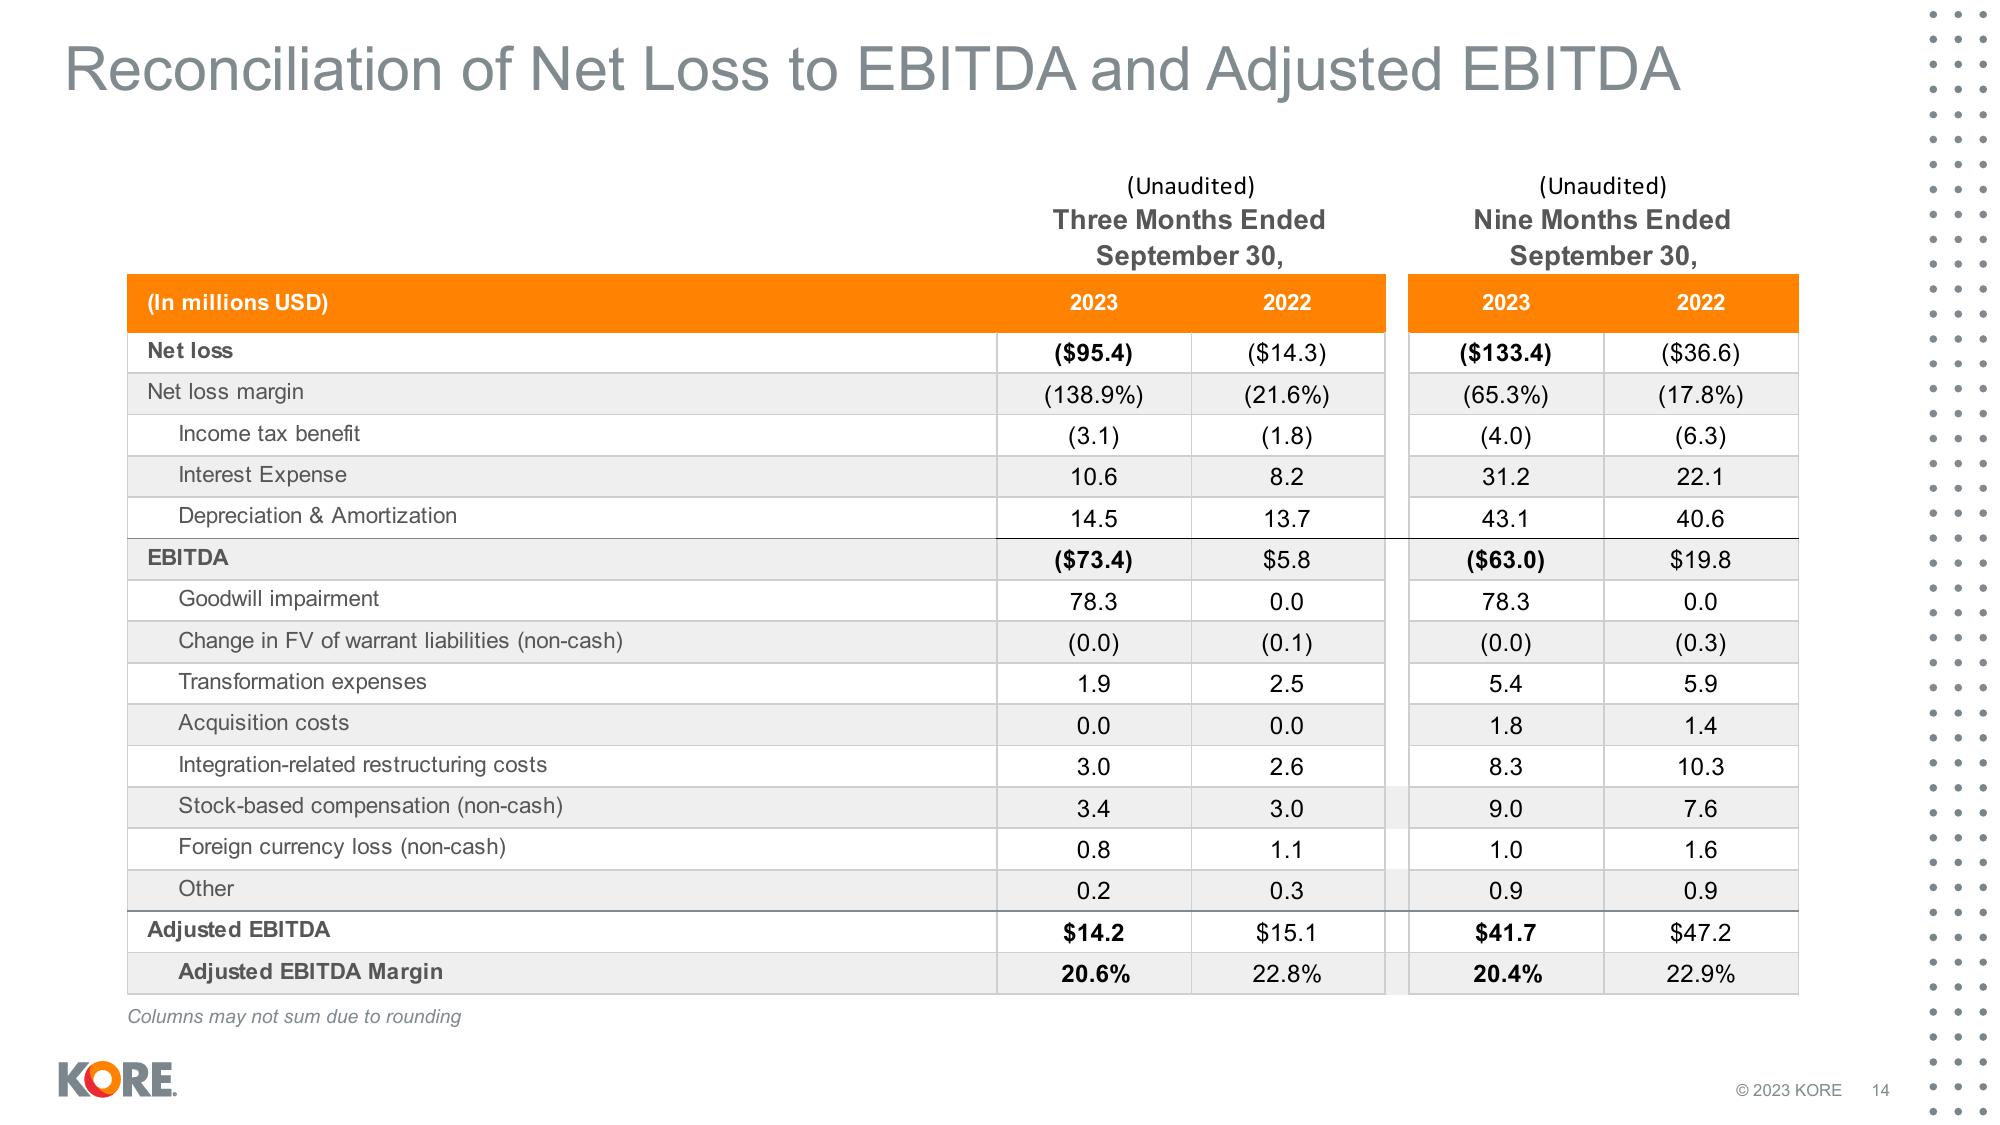
Reconciliation of Net Loss to EBITDA and Adjusted EBITDA
(In millions USD)
Net loss
Net loss margin
Income tax benefit
Interest Expense
Depreciation & Amortization
EBITDA
Goodwill impairment
Change in FV of warrant liabilities (non-cash)
Transformation expenses
Acquisition costs
Integration-related restructuring costs
Stock-based compensation (non-cash)
Foreign currency loss (non-cash)
Other
Adjusted EBITDA
KORE
Adjusted EBITDA Margin
Columns may not sum due to rounding
(Unaudited)
Three Months Ended
September 30,
2023
($95.4)
(138.9%)
(3.1)
10.6
14.5
($73.4)
78.3
(0.0)
1.9
0.0
3.0
3.4
0.8
0.2
$14.2
20.6%
2022
($14.3)
(21.6%)
(1.8)
8.2
13.7
$5.8
0.0
(0.1)
2.5
0.0
2.6
3.0
1.1
0.3
$15.1
22.8%
(Unaudited)
Nine Months Ended
September 30,
2023
($133.4)
(65.3%)
(4.0)
31.2
43.1
($63.0)
78.3
(0.0)
5.4
1.8
8.3
9.0
1.0
0.9
$41.7
20.4%
2022
($36.6)
(17.8%)
(6.3)
22.1
40.6
$19.8
0.0
(0.3)
5.9
1.4
10.3
7.6
1.6
0.9
$47.2
22.9%
© 2023 KORE 14
●
●
●
●
● ..
•
●
●
●
●
● ● ●
●
●
•
●
●
●
●
●
●
●
●
● 0
●View entire presentation