Comcast Results Presentation Deck
Content &
Experiences
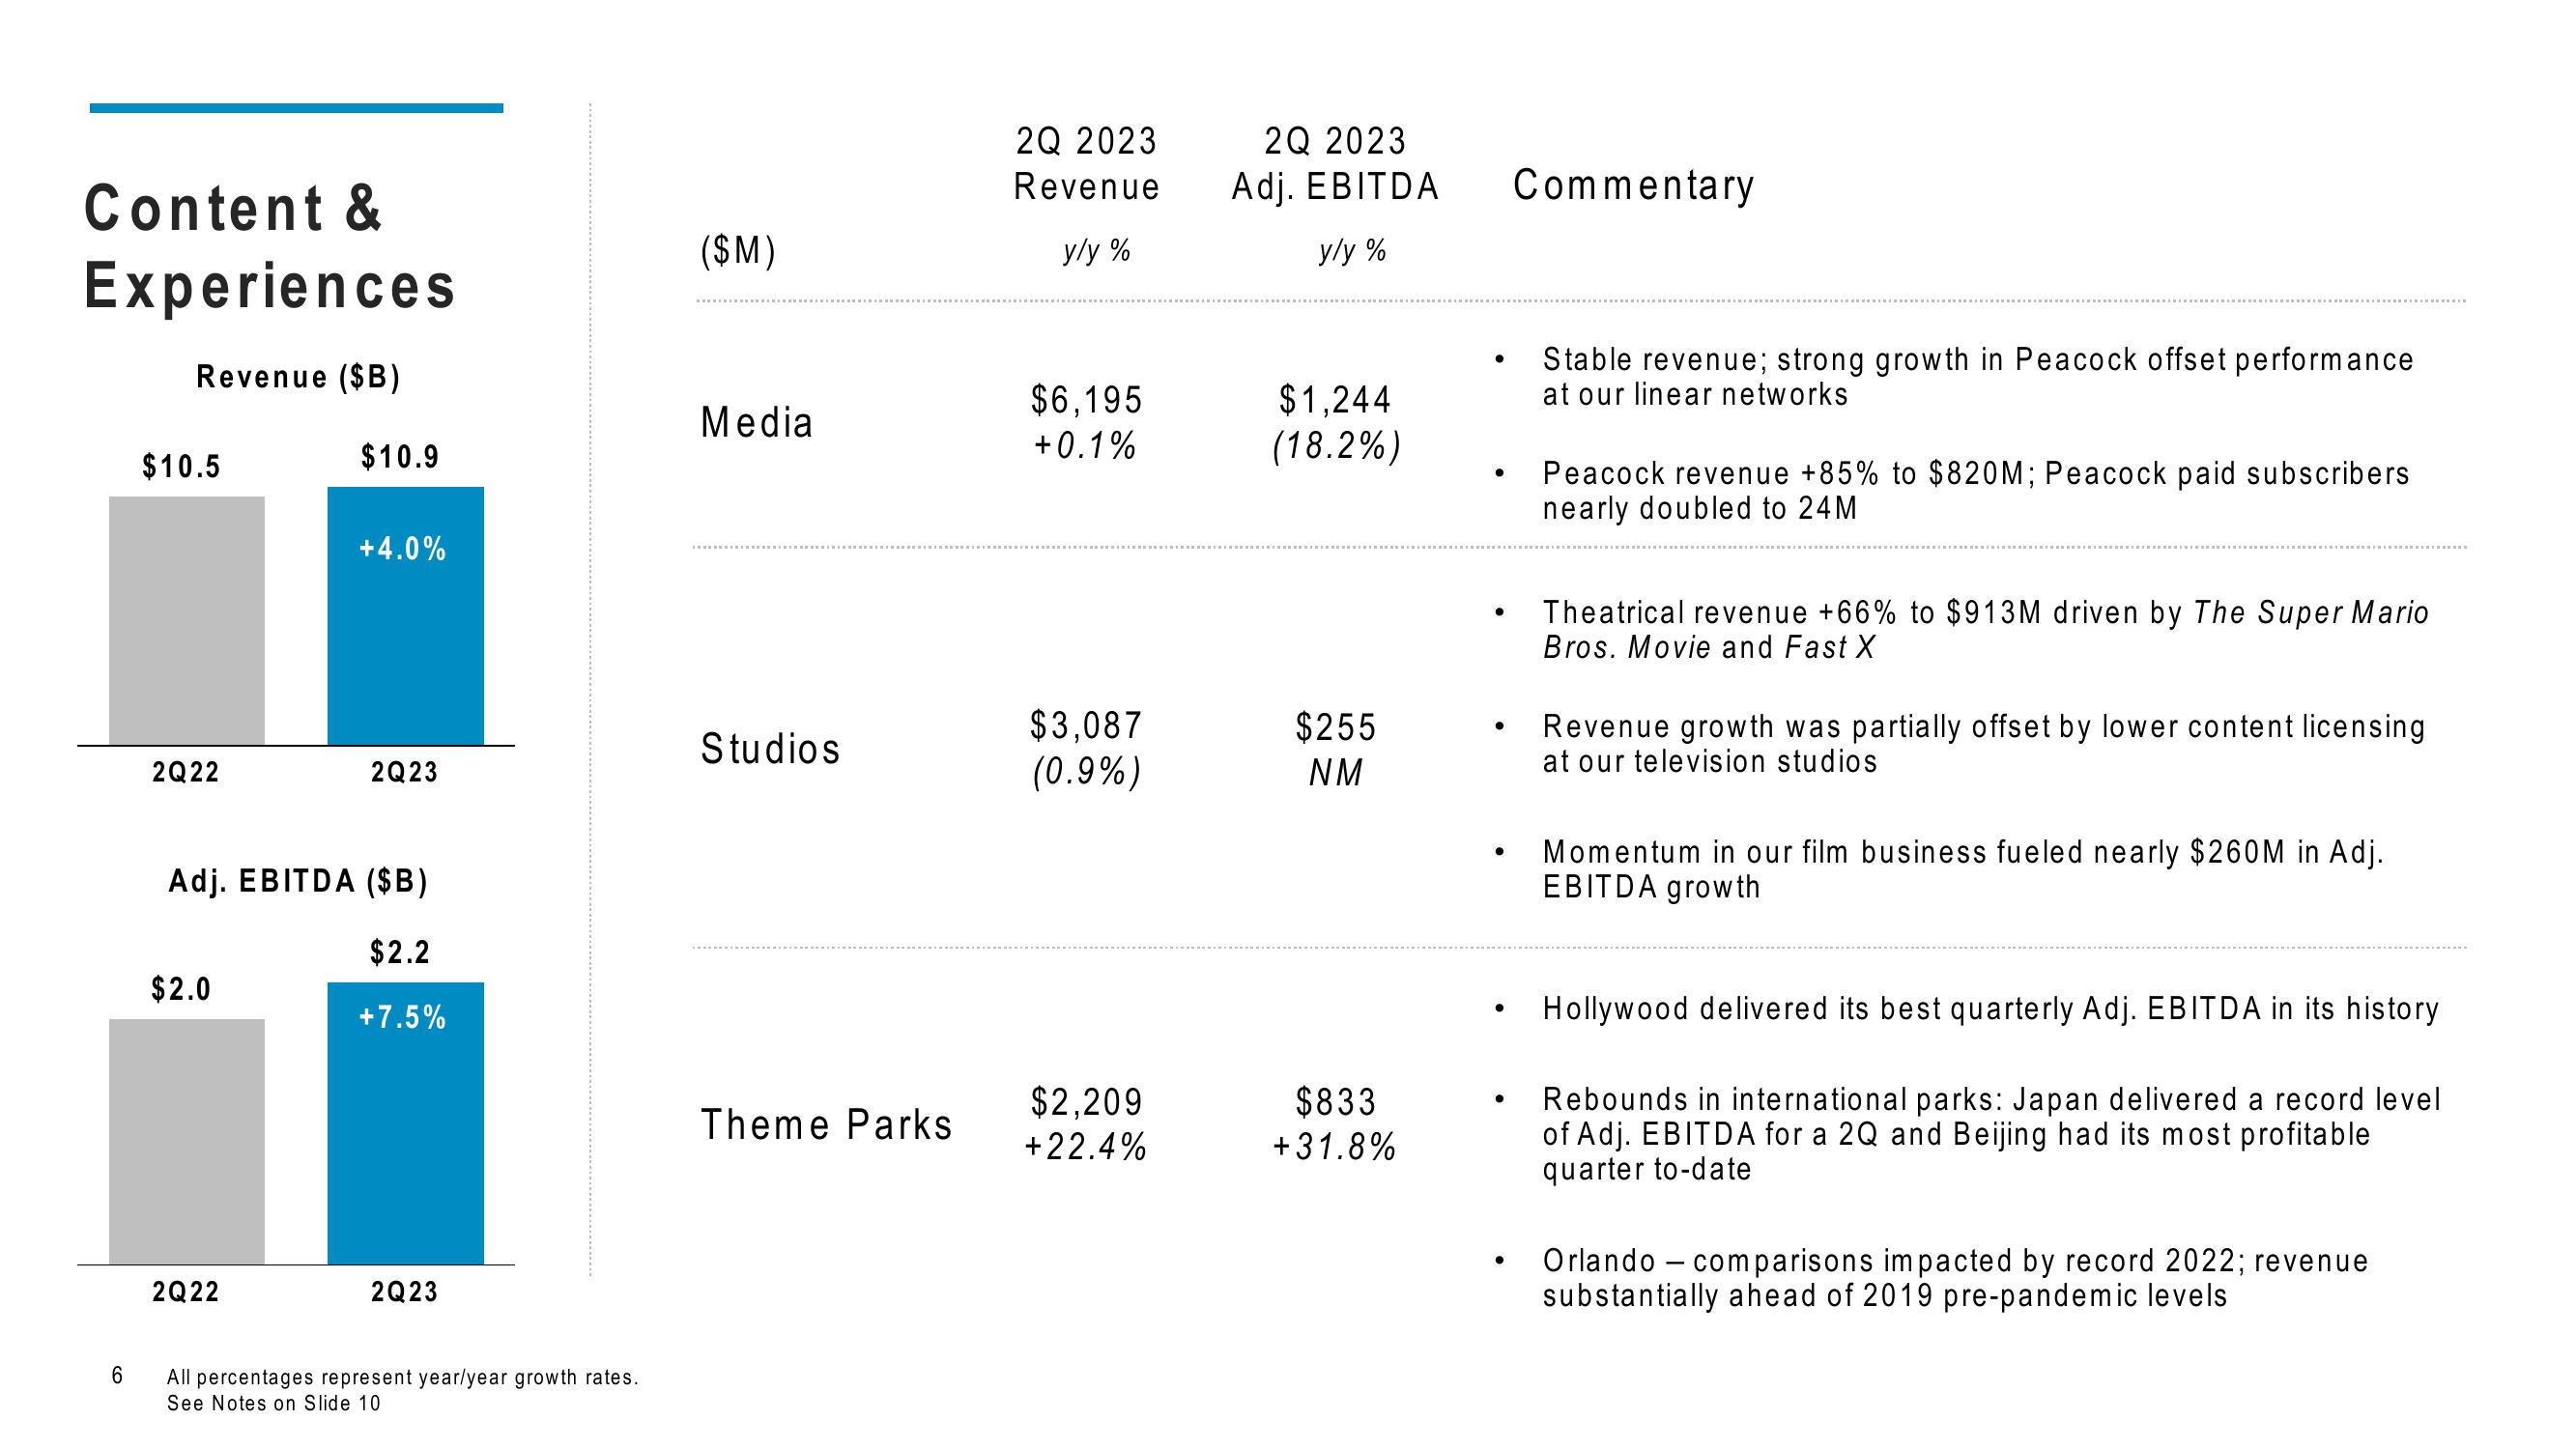
Revenue ($B)
6
$10.5
2Q22
$2.0
$10.9
2Q22
+4.0%
Adj. EBITDA ($B)
$2.2
+7.5%
2Q23
2Q23
All percentages represent year/year growth rates.
See Notes on Slide 10
($M)
Media
Studios
Theme Parks
2Q 2023
Revenue
y/y%
$6,195
+0.1%
$3,087
(0.9%)
$2,209
+22.4%
2Q 2023
Adj. EBITDA
y/y%
$1,244
(18.2%)
$255
NM
$833
+31.8%
●
●
●
●
●
●
●
Commentary
Stable revenue; strong growth in Peacock offset performance
at our linear networks
Peacock revenue +85% to $820M; Peacock paid subscribers
nearly doubled to 24 M
Theatrical revenue +66% to $913M driven by The Super Mario
Bros. Movie and Fast X
Revenue growth was partially offset by lower content licensing
at our television studios
Momentum in our film business fueled nearly $260M in Adj.
EBITDA growth
Hollywood delivered its best quarterly Adj. EBITDA in its history
Rebounds in international parks: Japan delivered a record level
of Adj. EBITDA for a 2Q and Beijing had its most profitable
quarter to-date
Orlando - comparisons impacted by record 2022; revenue
substantially ahead of 2019 pre-pandemic levelsView entire presentation