Informa 1H23 Results
B2B Market Growth: Aviation Routes, Seats and Revenue
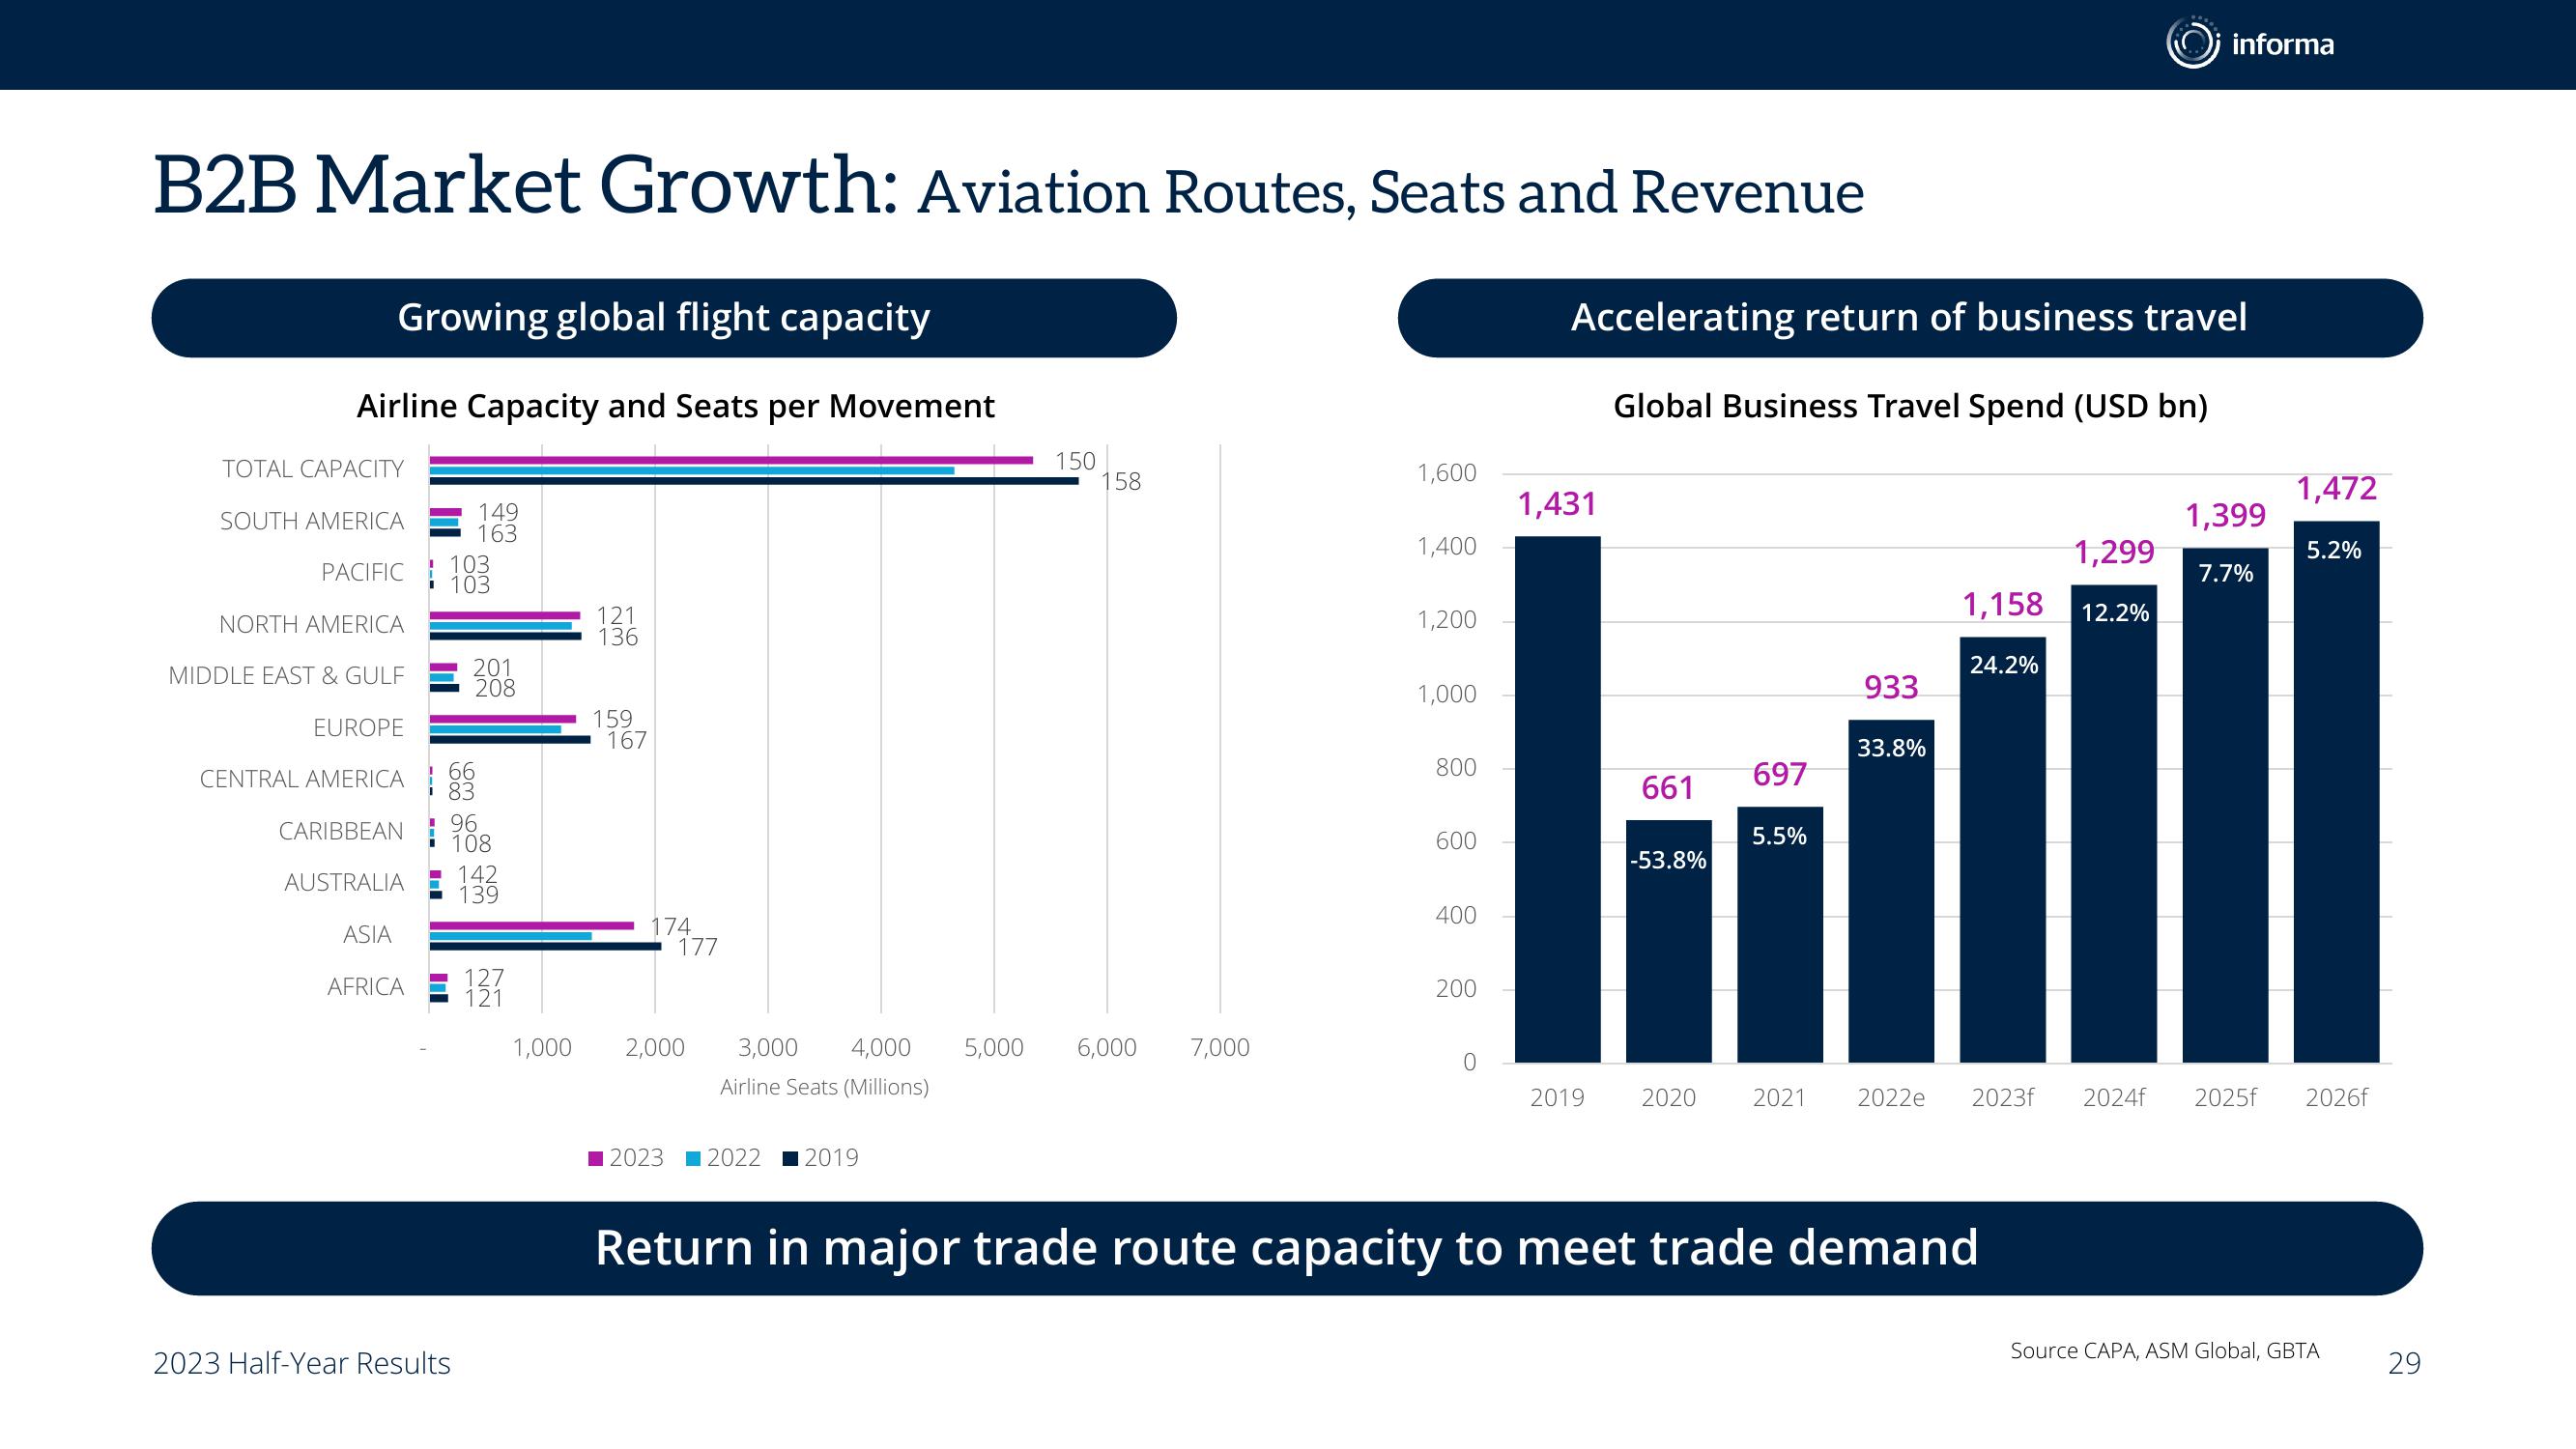
Growing global flight capacity
Airline Capacity and Seats per Movement
TOTAL CAPACITY
SOUTH AMERICA
PACIFIC
NORTH AMERICA
MIDDLE EAST & GULF
CARIBBEAN
AUSTRALIA
EUROPE
CENTRAL AMERICA 66
1
83
ASIA
AFRICA
103
103
680
149
163
201
208
CM
91
68
2023 Half-Year Results
96
108
142
139
127
121
1,000
121
136
159
167
174
177
2,000
150
2023 2022 2019
158
3,000 4,000 5,000 6,000 7,000
Airline Seats (Millions)
1,600
1,400
1,200
1,000
800
600
400
200
0
Accelerating return of business travel
Global Business Travel Spend (USD bn)
1,431
2019
661
-53.8%
2020
697
5.5%
933
33.8%
1,158
24.2%
2021 2022e 2023f
Return in major trade route capacity to meet trade demand
1,299
informa
12.2%
1,399
7.7%
1,472
5.2%
2024f 2025f 2026f
Source CAPA, ASM Global, GBTA
29View entire presentation