Cytek IPO Presentation Deck
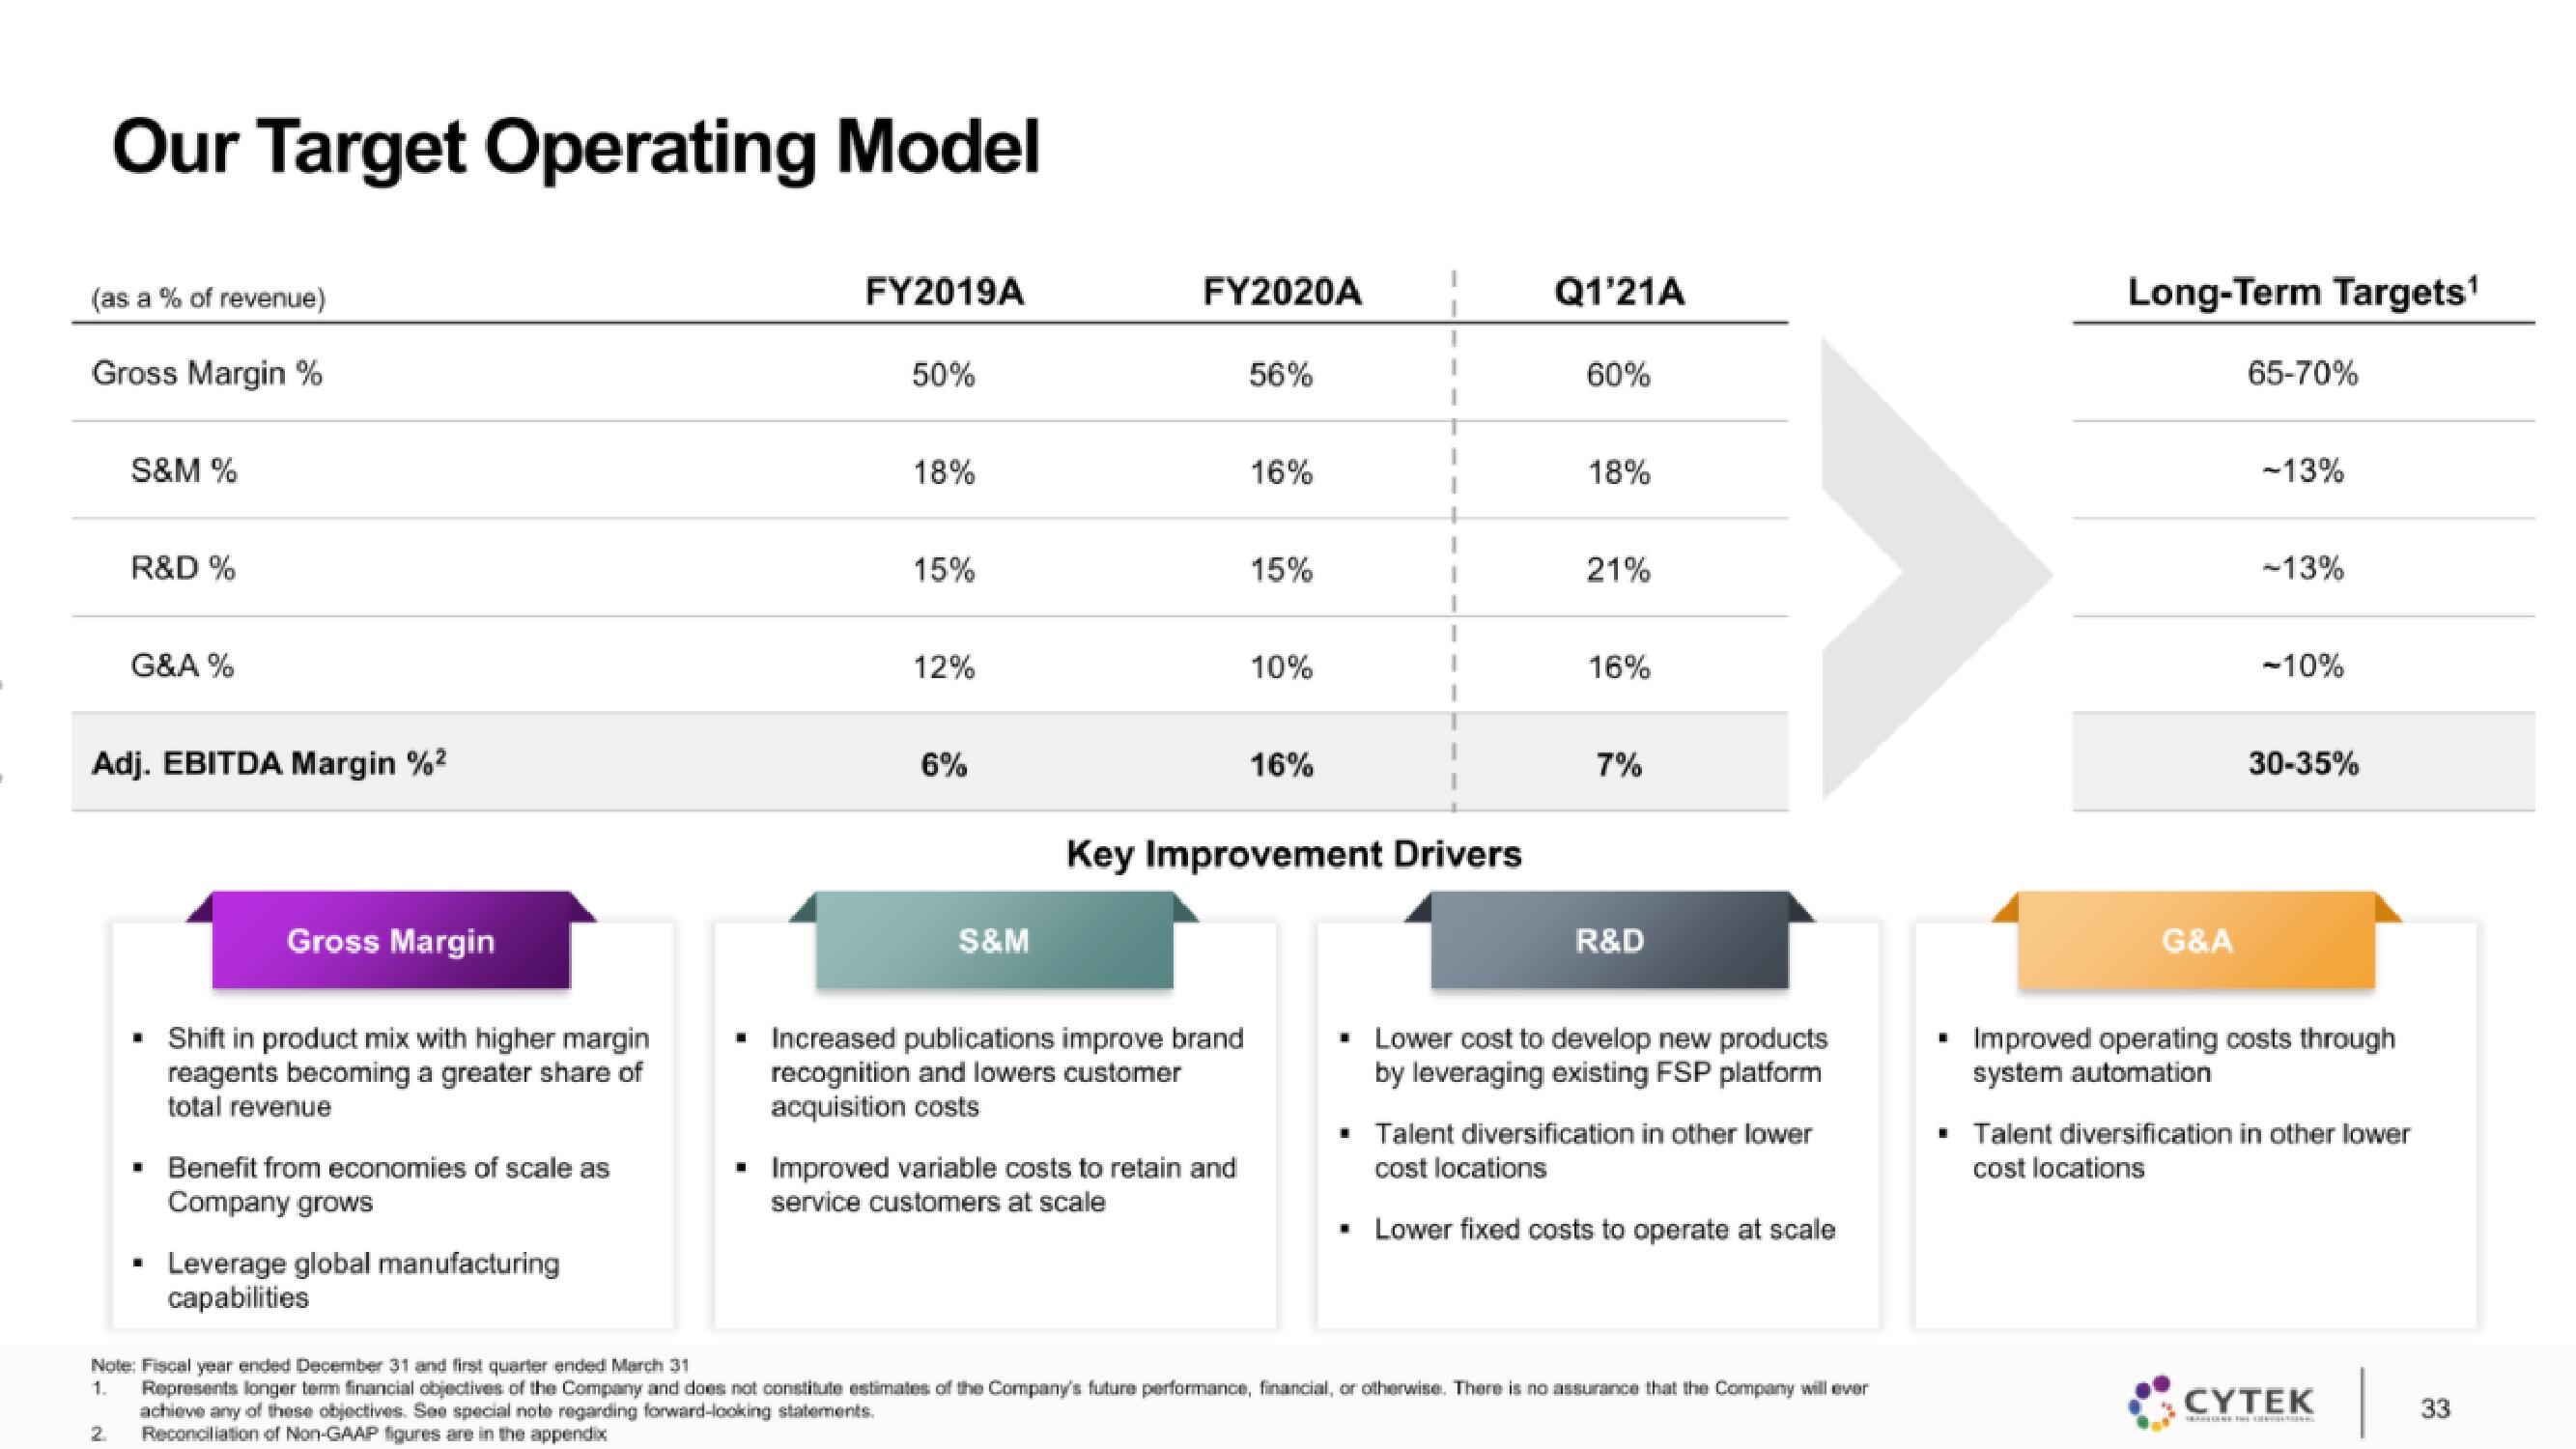
Our Target Operating Model
(as a % of revenue)
Gross Margin %
S&M %
2
R&D %
G&A %
Adj. EBITDA Margin %²
Gross Margin
■ Shift in product mix with higher margin
reagents becoming a greater share of
total revenue
▪ Benefit from economies of scale as
Company grows
Leverage global manufacturing
capabilities
■
FY2019A
50%
18%
15%
12%
6%
S&M
FY2020A
Increased publications improve brand
recognition and lowers customer
acquisition costs
56%
Improved variable costs to retain and
service customers at scale
16%
15%
10%
Key Improvement Drivers
16%
Q1'21A
60%
18%
21%
16%
7%
R&D
■ Lower cost to develop new products
by leveraging existing FSP platform
■ Talent diversification in other lower
cost locations
▪ Lower fixed costs to operate at scale
Note: Fiscal year ended December 31 and first quarter ended March 31
1.
Represents longer term financial objectives of the Company and does not constitute estimates of the Company's future performance, financial, or otherwise. There is no assurance that the Company will ever
achieve any of these objectives. See special note regarding forward-looking statements.
Reconciliation of Non-GAAP figures are in the appendix
Long-Term Targets¹
G&A
65-70%
-13%
-13%
-10%
30-35%
• Improved operating costs through
system automation
■ Talent diversification in other lower
cost locations
CYTEK
|
33View entire presentation