Enfusion Results Presentation Deck
*:enfusion
REVENUES:
Platform subscriptions
Managed services
Other
Total revenues
COST OF REVENUES:
Platform subscriptions
Managed services
Other
Total cost of revenues
Gross profit
OPERATING EXPENSES:
General and administrative
Sales and marketing
Technology and development
Total operating expenses
Income (loss) from operations
NON-OPERATING (EXPENSE) INCOME:
Interest expense
Other (expense) income
Total non-operating expense
Income (loss) before income taxes
Income taxes
Net income (loss)
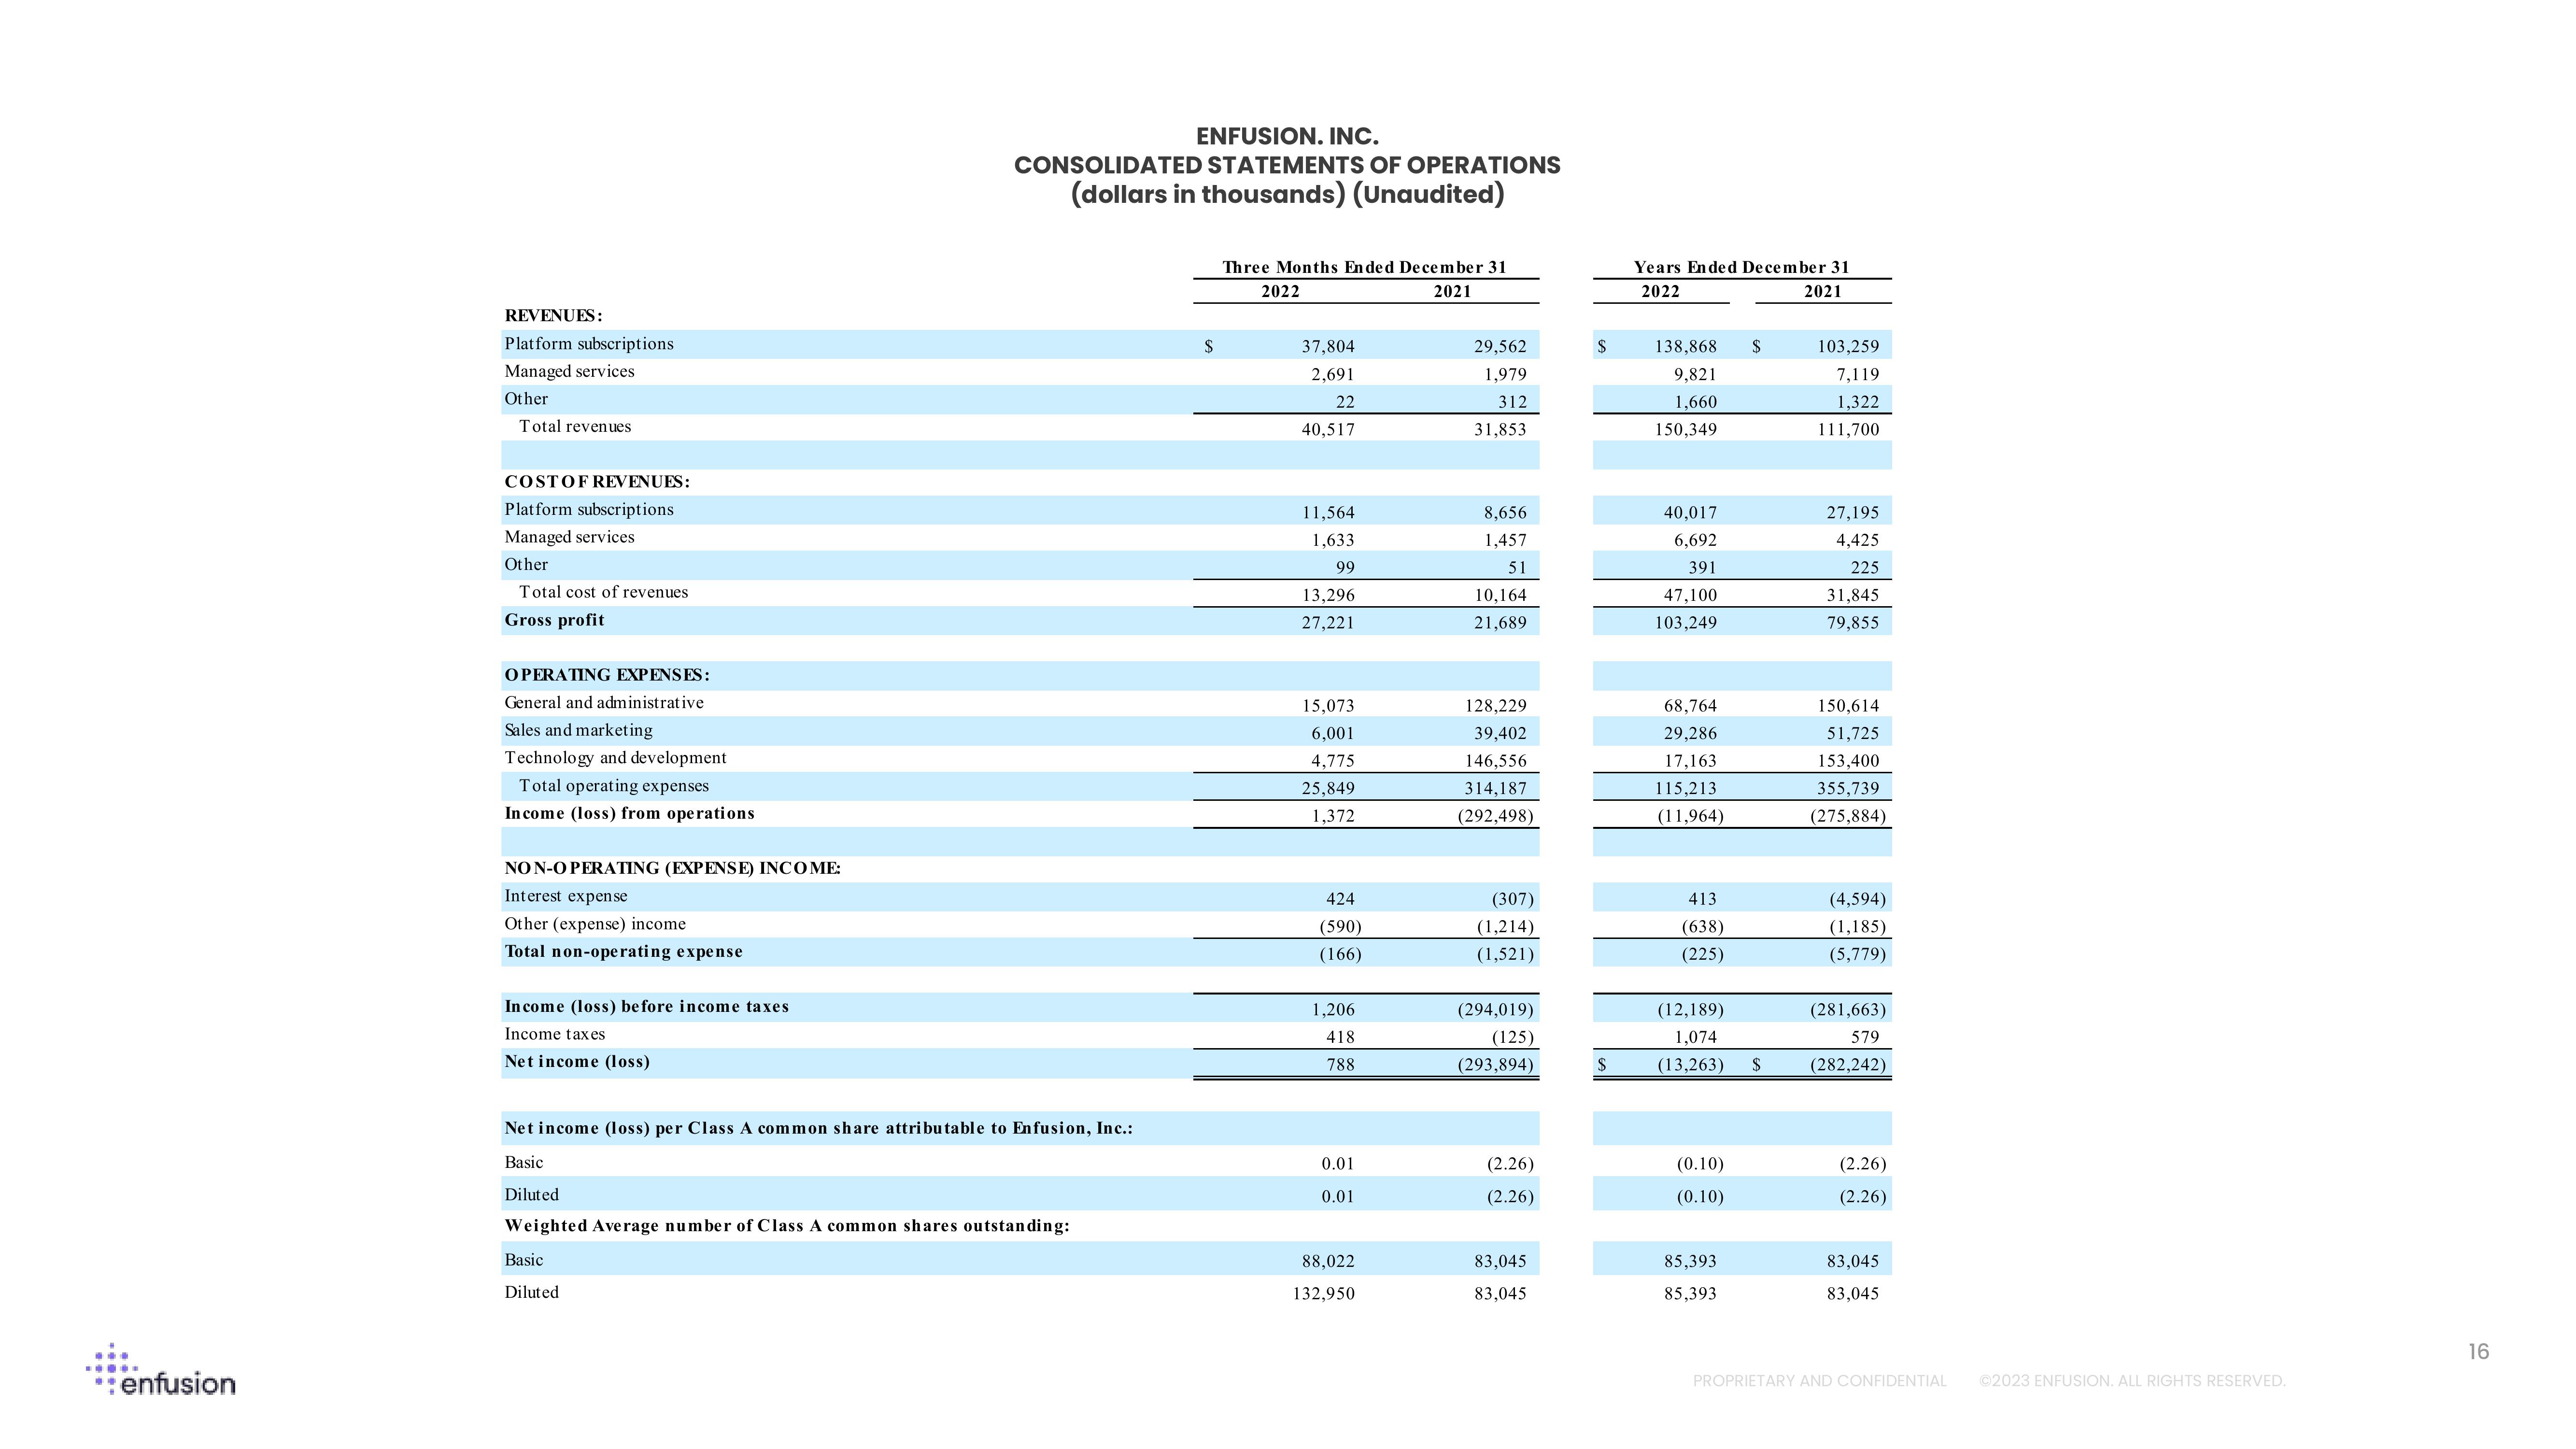
ENFUSION. INC.
CONSOLIDATED STATEMENTS OF OPERATIONS
(dollars in thousands) (Unaudited)
Net income (loss) per Class common share attributable to Enfi ion, Inc.:
Basic
Diluted
Weighted Average number of Class A common shares outstanding:
Basic
Diluted
$
Three Months Ended December 31
2022
2021
37,804
2,691
22
40,517
11,564
1,633
99
13,296
27,221
15,073
6,001
4,775
25,849
1,372
424
(590)
(166)
1,206
418
788
0.01
0.01
88,022
132,950
29,562
1,979
312
31,853
8,656
1,457
51
10,164
21,689
128,229
39,402
146,556
314,187
(292,498)
(307)
(1,214)
(1,521)
(294,019)
(125)
(293,894)
(2.26)
(2.26)
83,045
83,045
$
$
Years Ended December 31
2022
2021
138,868
9,821
1,660
150.349
40,017
6,692
391
47,100
103,249
68,764
29,286
17,163
115,213
(11,964)
413
(638)
(225)
(12,189)
1,074
(13,263)
(0.10)
(0.10)
85,393
85,393
$
$
103,259
7,119
1,322
111,700
27,195
4,425
225
31,845
79,855
150,614
51,725
153,400
355,739
(275,884)
(4,594)
(1,185)
(5,779)
(281,663)
579
(282,242)
(2.26)
(2.26)
83,045
83,045
PROPRIETARY AND CONFIDENTIAL Ⓒ2023 ENFUSION. ALL RIGHTS RESERVED.
16View entire presentation