Twitter Investor Day slide image

Twitter Investor Day

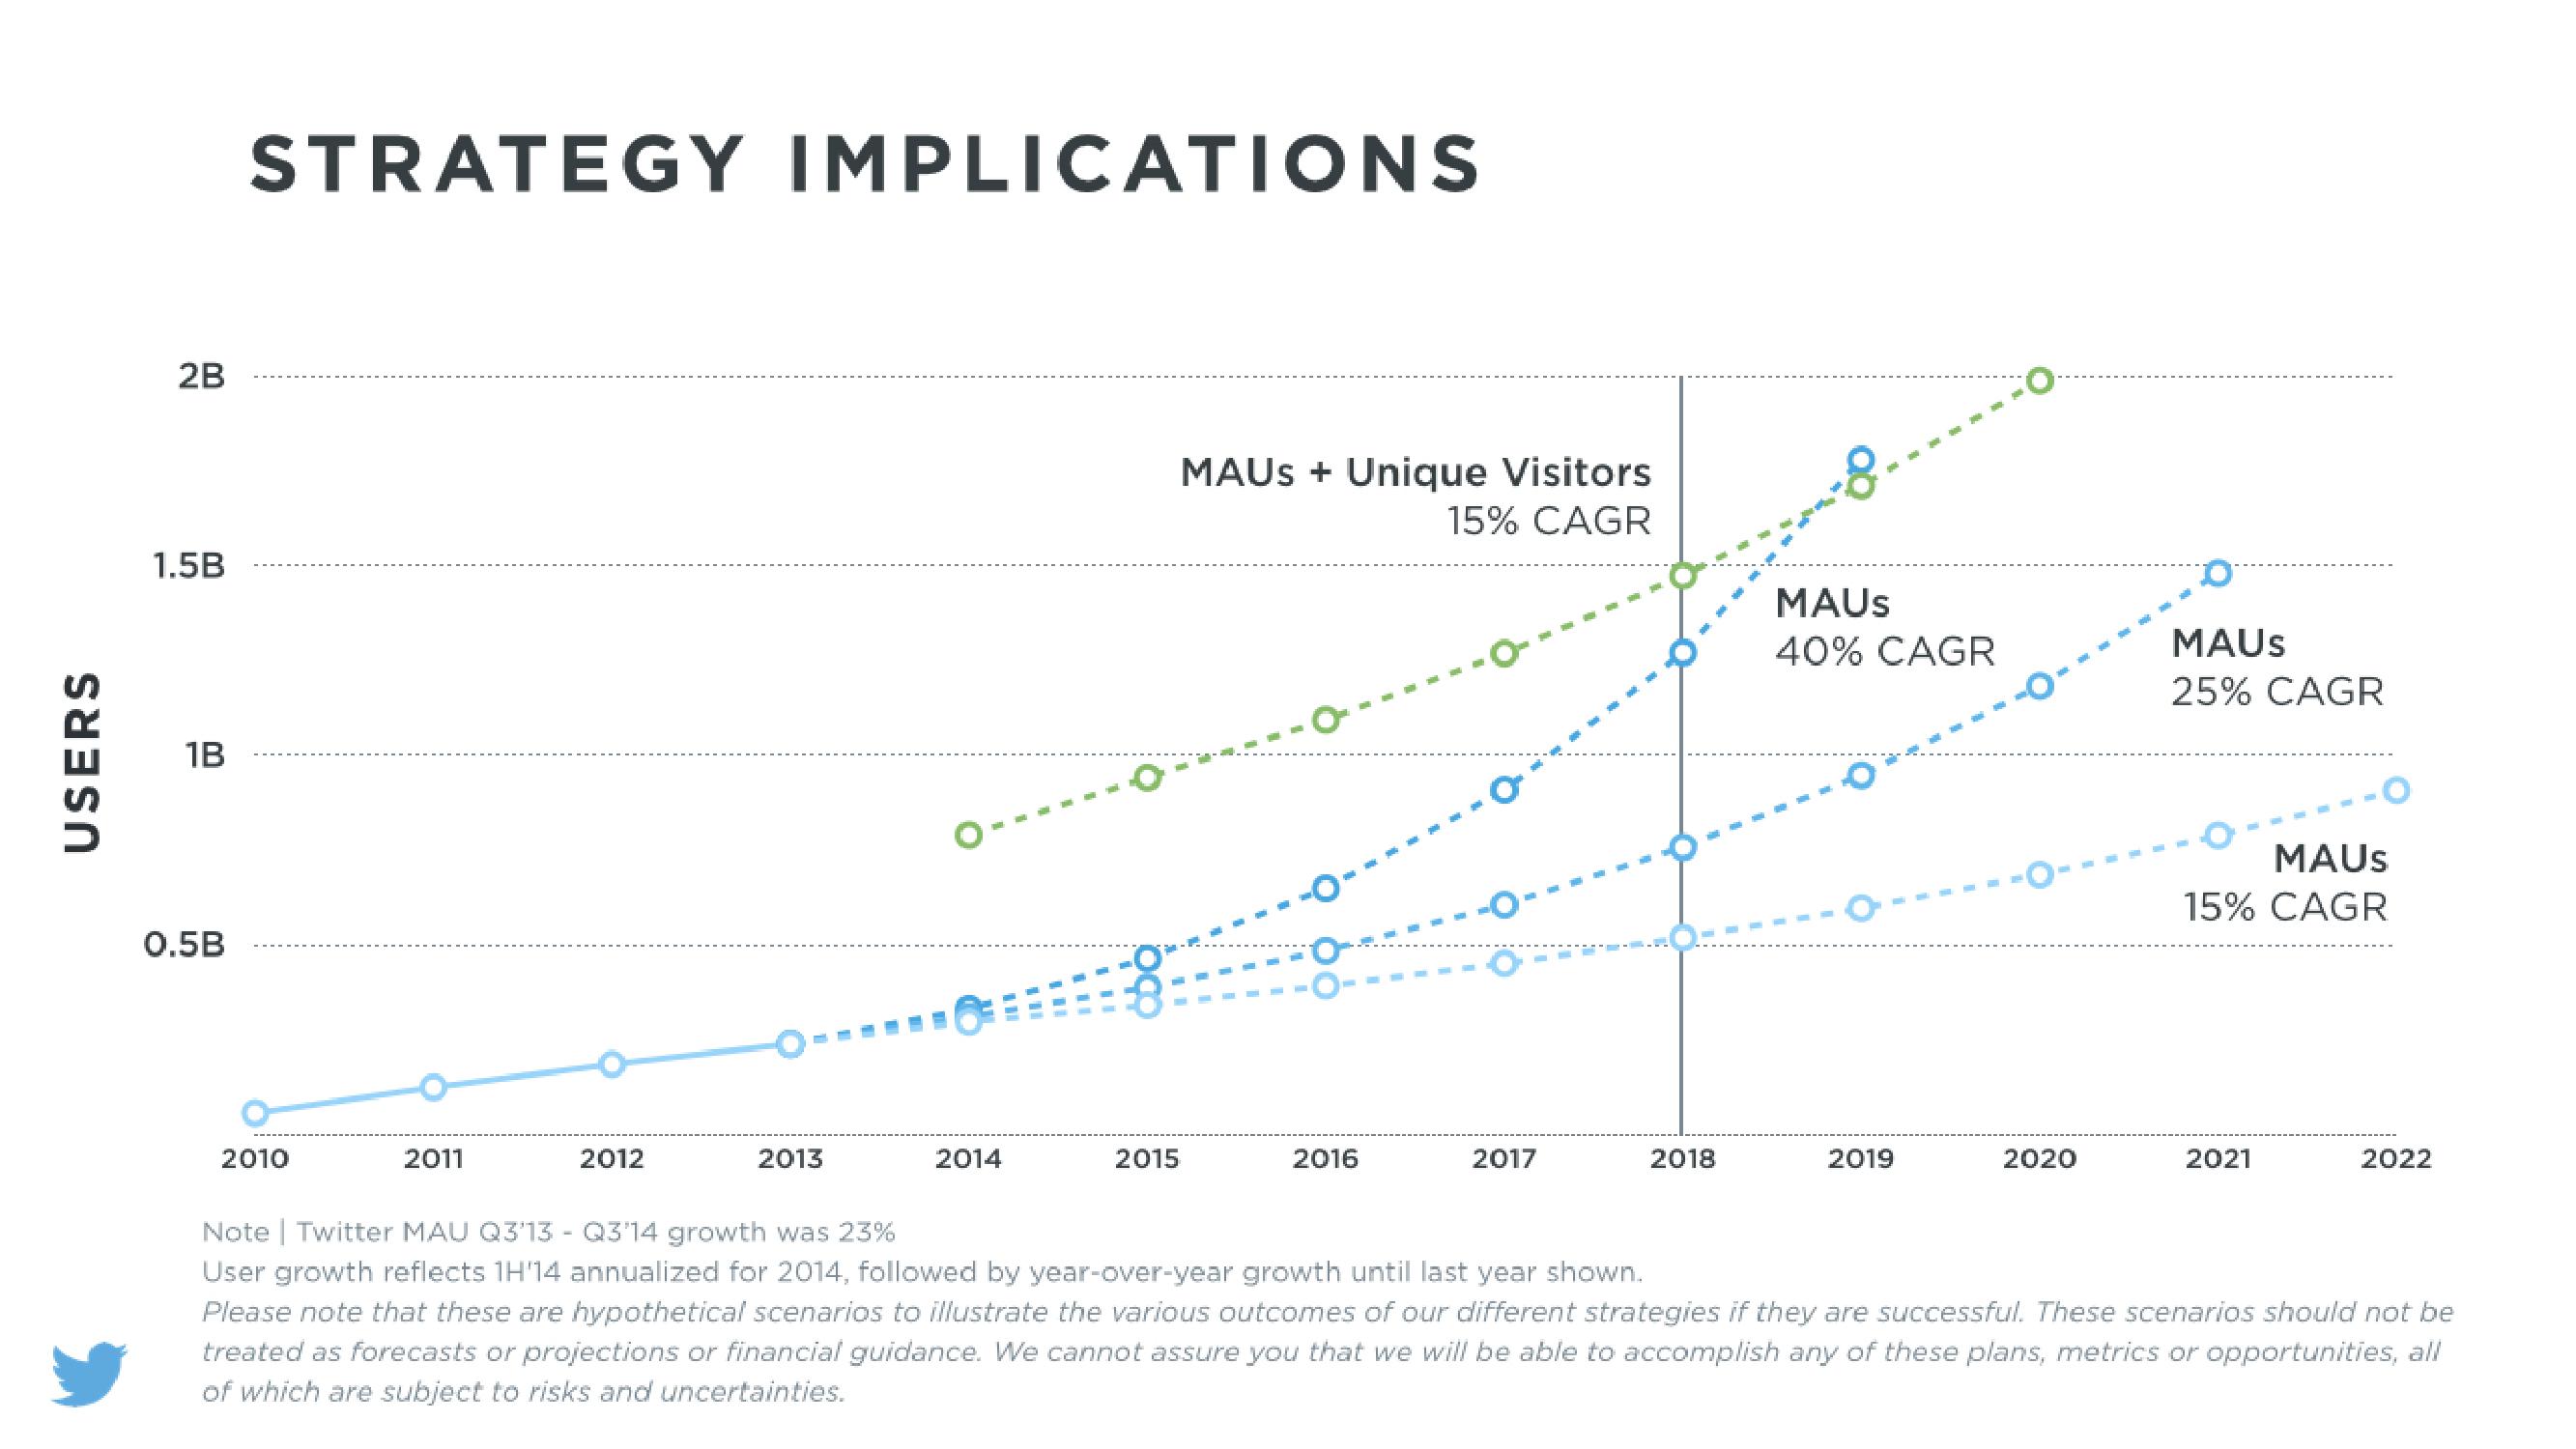
USERS 2B 1.5B 1B 0.5B STRATEGY IMPLICATIONS 2010 2011 2012 2013 2014 8 2015 MAUs + Unique Visitors 15% CAGR 2016 2017 2018 MAUS 40% CAGR 2019 2020 MAUS 25% CAGR MAUS 15% CAGR 2021 2022 Note | Twitter MAU Q3'13 Q3'14 growth was 23% User growth reflects 1H'14 annualized for 2014, followed by year-over-year growth until last year shown. Please note that these are hypothetical scenarios to illustrate the various outcomes of our different strategies if they are successful. These scenarios should not be treated as forecasts or projections or financial guidance. We cannot assure you that we will be able to accomplish any of these plans, metrics or opportunities, all of which are subject to risks and uncertainties.
View entire presentation