Sonos Results Presentation Deck slide image

Sonos Results Presentation Deck

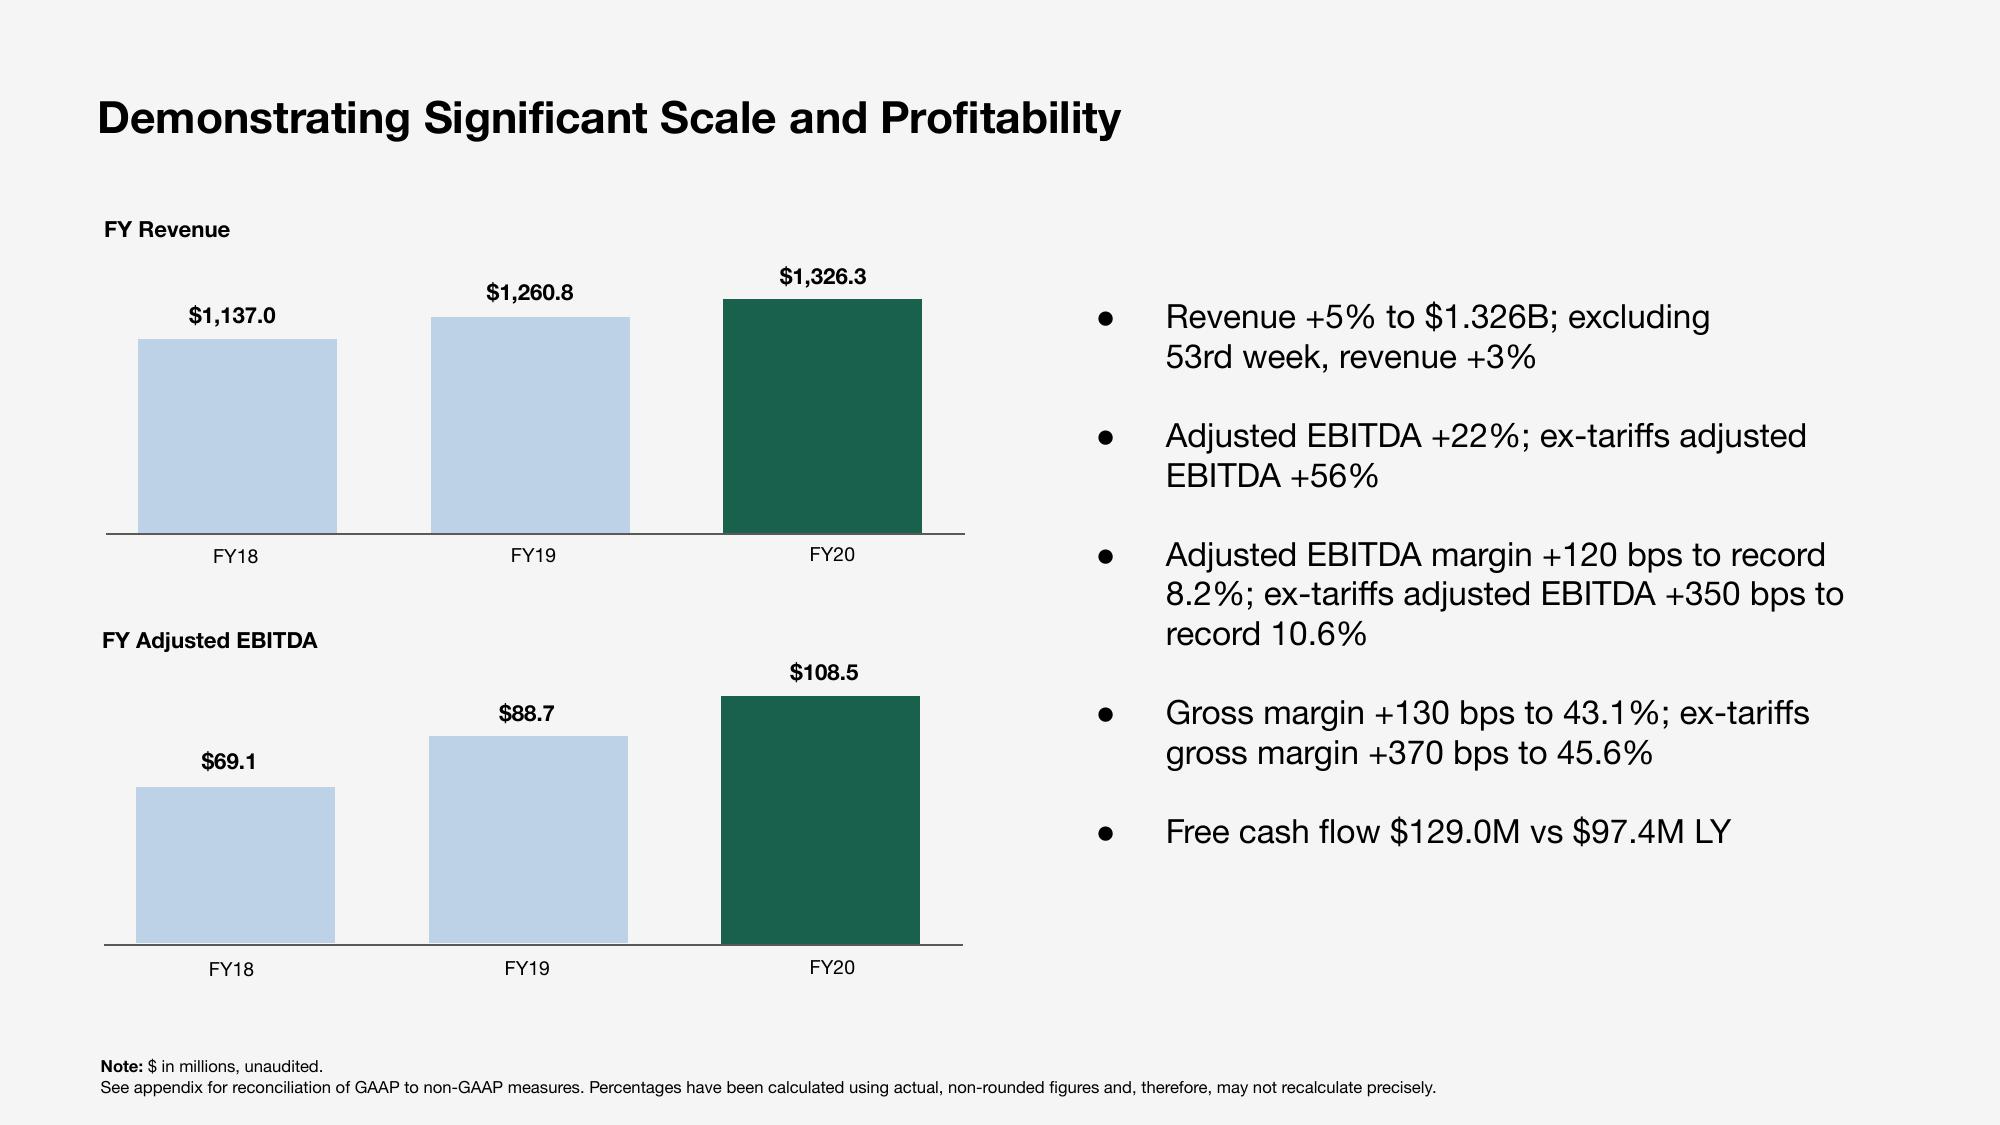
Demonstrating Significant Scale and Profitability FY Revenue $1,137.0 FY18 FY Adjusted EBITDA $69.1 FY18 $1,260.8 FY19 $88.7 FY19 $1,326.3 FY20 $108.5 FY20 Revenue +5% to $1.326B; excluding 53rd week, revenue +3% Adjusted EBITDA +22%; ex-tariffs adjusted EBITDA +56% Adjusted EBITDA margin +120 bps to record 8.2%; ex-tariffs adjusted EBITDA +350 bps to record 10.6% Gross margin +130 bps to 43.1%; ex-tariffs gross margin +370 bps to 45.6% Free cash flow $129.0M vs $97.4M LY Note: $ in millions, unaudited. See appendix for reconciliation of GAAP to non-GAAP measures. Percentages have been calculated using actual, non-rounded figures and, therefore, may not recalculate precisely.
View entire presentation