HBT Financial Results Presentation Deck
Non-GAAP Reconciliations (cont'd)
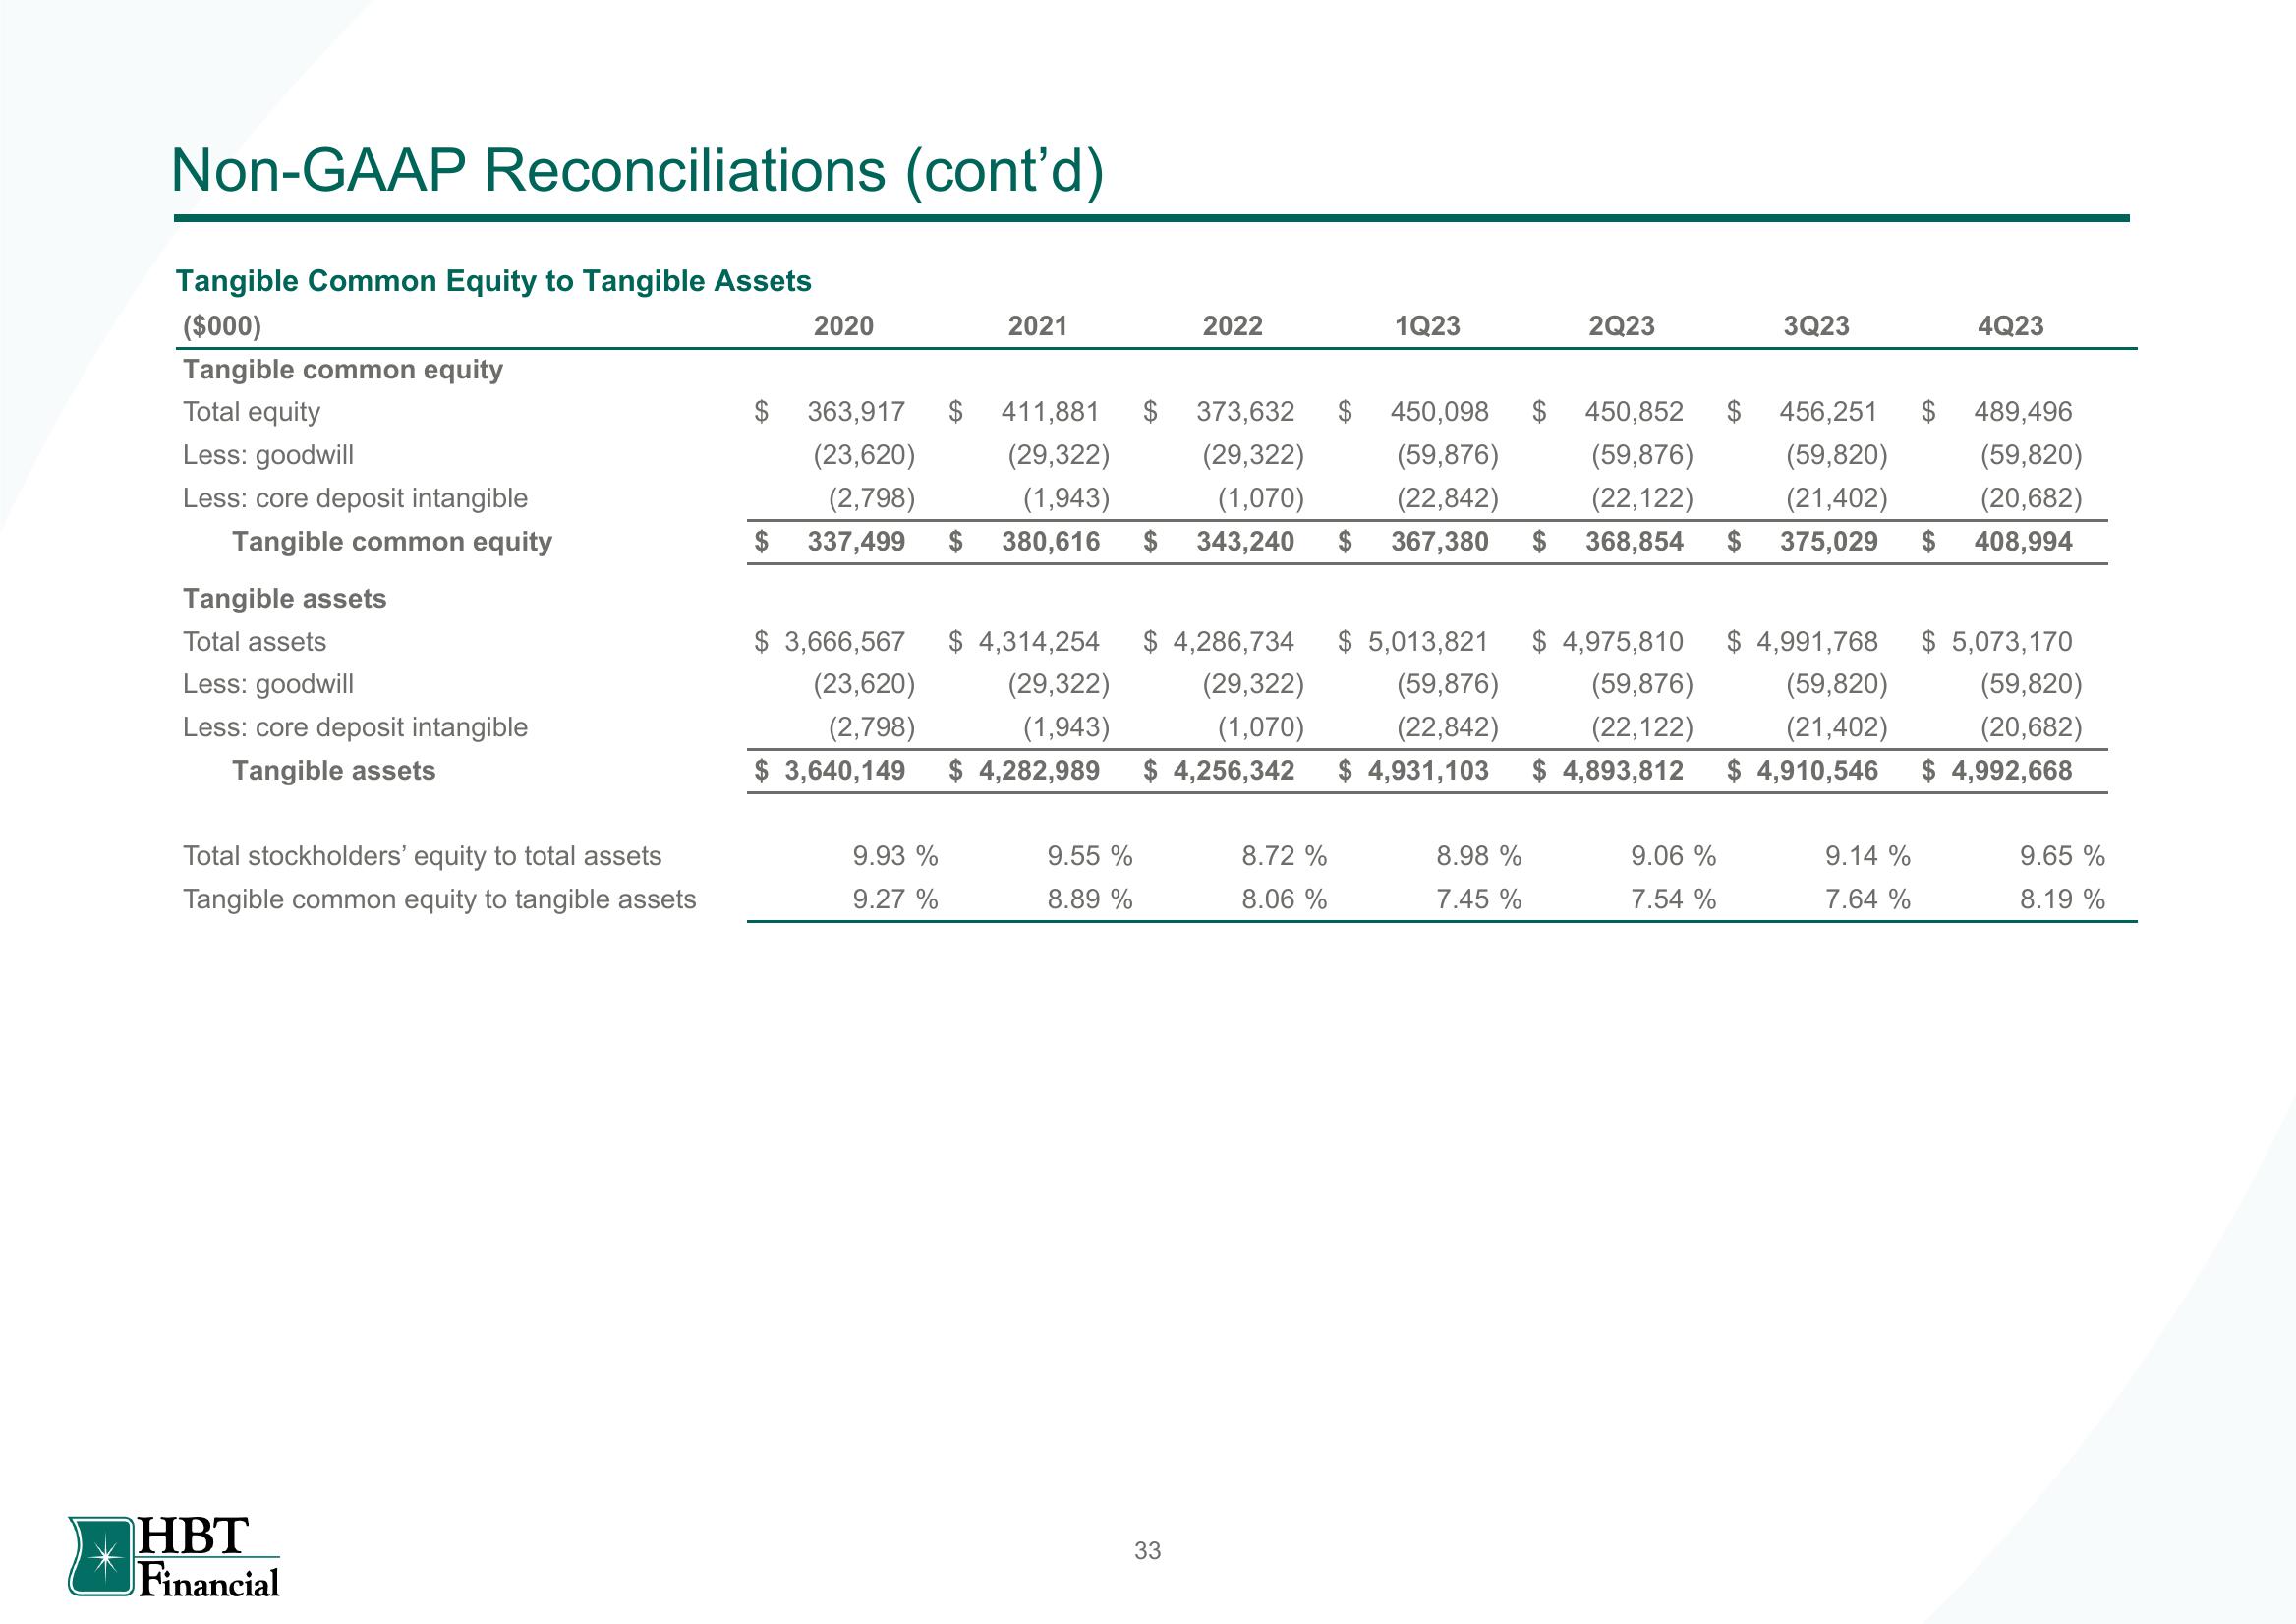
Tangible Common Equity to Tangible Assets
($000)
Tangible common equity
Total equity
Less: goodwill
Less: core deposit intangible
Tangible common equity
Tangible assets
Total assets
Less: goodwill
Less: core deposit intangible
Tangible assets
Total stockholders' equity to total assets
Tangible common equity to tangible assets
HBT
Financial
$
2020
2021
363,917 $ 411,881 $
$ 450,098 $
(23,620)
(29,322)
(1,943)
373,632
(29,322)
(1,070)
(59,876)
(22,842)
(2,798)
$ 337,499 $ 380,616 $ 343,240 $ 367,380
9.93 %
9.27 %
2022
9.55 %
8.89 %
33
1Q23
$ 3,666,567 $ 4,314,254 $ 4,286,734 $ 5,013,821 $ 4,975,810 $ 4,991,768
(23,620)
(2,798)
(29,322) (29,322)
(1,943)
(1,070)
$ 4,282,989 $ 4,256,342
(59,876) (59,876)
(22,842) (22,122)
$ 4,931,103 $ 4,893,812
(59,820)
(21,402)
$ 3,640,149
$ 4,910,546
8.72%
8.06 %
2Q23
8.98 %
7.45 %
3Q23
450,852 $ 456,251
(59,876) (59,820)
(22,122) (21,402)
$ 368,854 $ 375,029
9.06 %
7.54%
9.14%
7.64 %
4Q23
$ 489,496
(59,820)
(20,682)
$ 408,994
$ 5,073,170
(59,820)
(20,682)
$ 4,992,668
9.65 %
8.19 %View entire presentation