Yatsen Results Presentation Deck
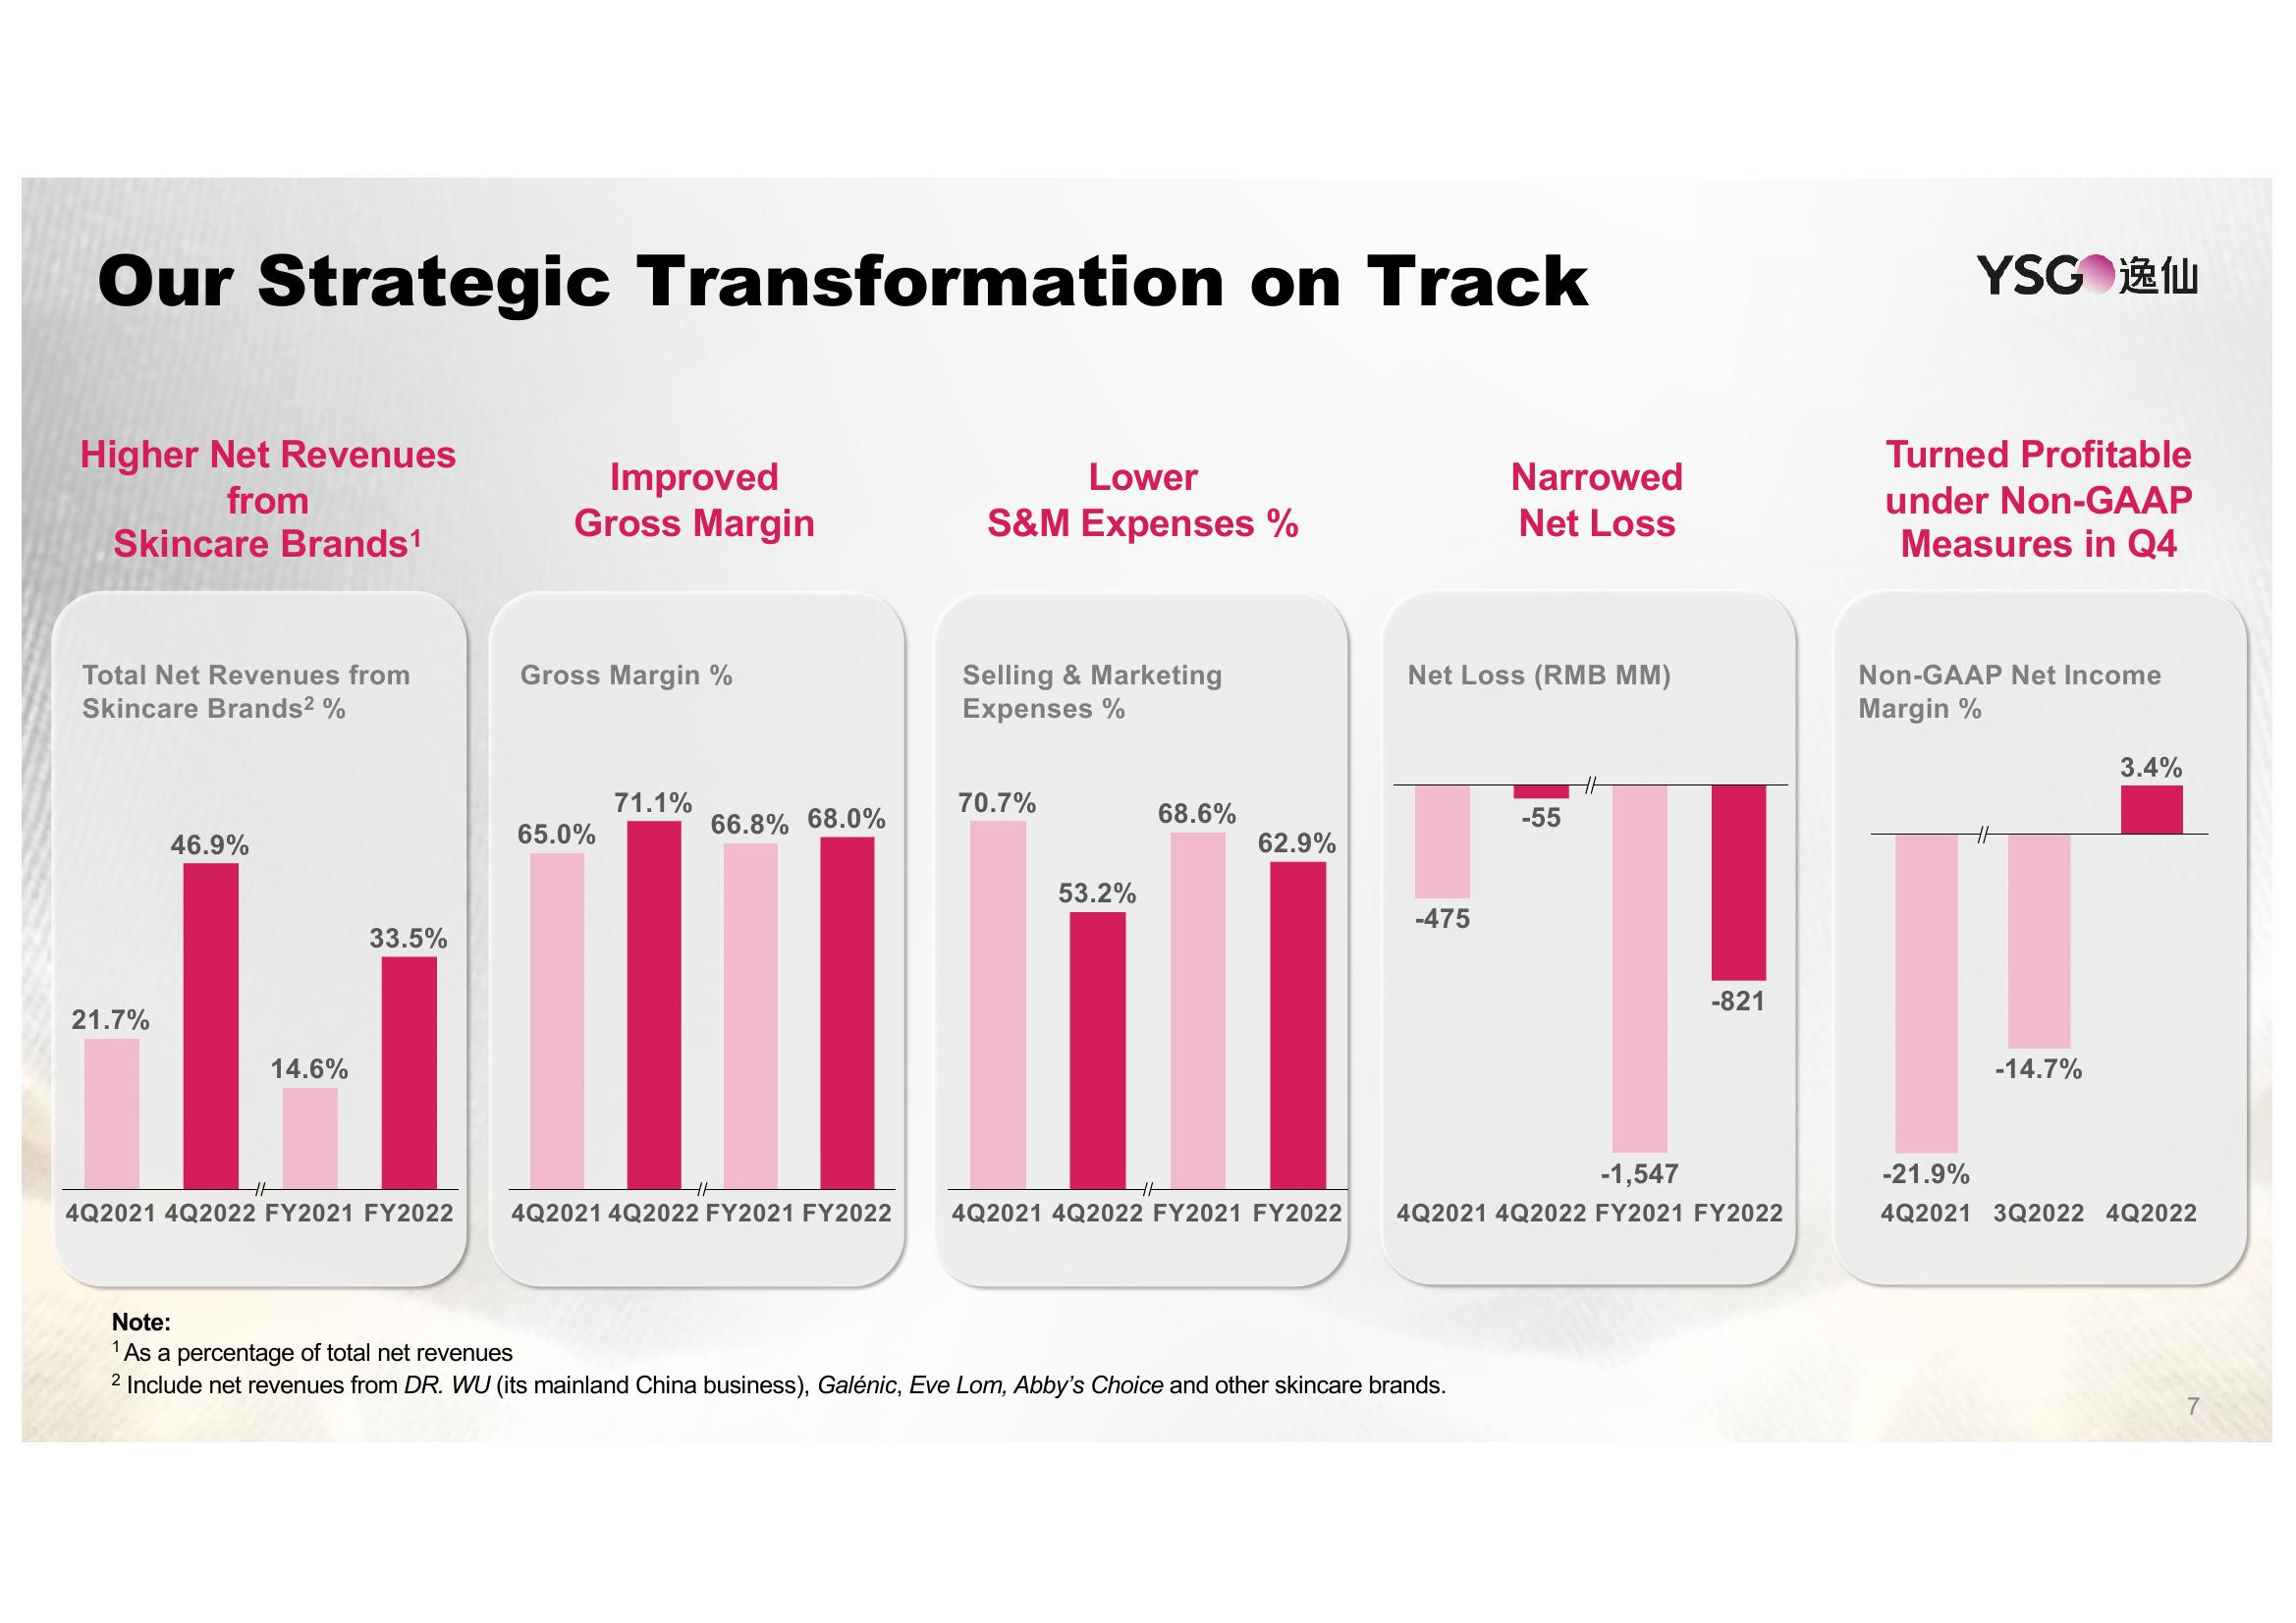
Our Strategic Transformation on Track
Higher Net Revenues
from
Skincare Brands¹
Total Net Revenues from
Skincare Brands² %
21.7%
46.9%
Improved
Gross Margin
65.0%
33.5%
|||
14.6%
4Q2021 4Q2022 FY2021 FY2022
4Q2021 4Q2022 FY2021 FY2022
HH
Gross Margin %
71.1%
66.8% 68.0%
Lower
S&M Expenses %
Selling & Marketing
Expenses %
70.7%
53.2%
68.6%
62.9%
4Q2021 4Q2022 FY2021 FY2022
Net Loss (RMB MM)
-475
Narrowed
Net Loss
Note:
¹ As a percentage of total net revenues
2 Include net revenues from DR. WU (its mainland China business), Galénic, Eve Lom, Abby's Choice and other skincare brands.
-55
-821
-1,547
4Q2021 4Q2022 FY2021 FY2022
YSG 逸仙
urned Profitable
under Non-GAAP
Measures in Q4
Non-GAAP Net Income
Margin %
HH
-14.7%
3.4%
-21.9%
4Q2021 3Q2022 4Q2022
7View entire presentation