OppFi Results Presentation Deck
8
Condensed Balance Sheet
($ in millions)
Assets
Cash and restricted cash
Finance Receivables at Fair Value
Finance Receivables at Amortized
Cost, Net
Other Assets
Total Assets
Unaudited Period Ended,
3/31/2022
12/31/2021
Liabilities and Stockholders'/Members'
Other Liabilities
Total Debt
Warrant Liabilities
Total Liabilities
Total Equity
Total Liabilities and Equity
$62.4
383.9
4.2
51.6
$502.1
Equity
$59.0
274.0
11.2
344.2
157.9
$502.1
$59.9
381.8
4.8
66.0
$512.5
$66.3
280.9
8.8
356.0
156.5
$512.5
Key Highlights
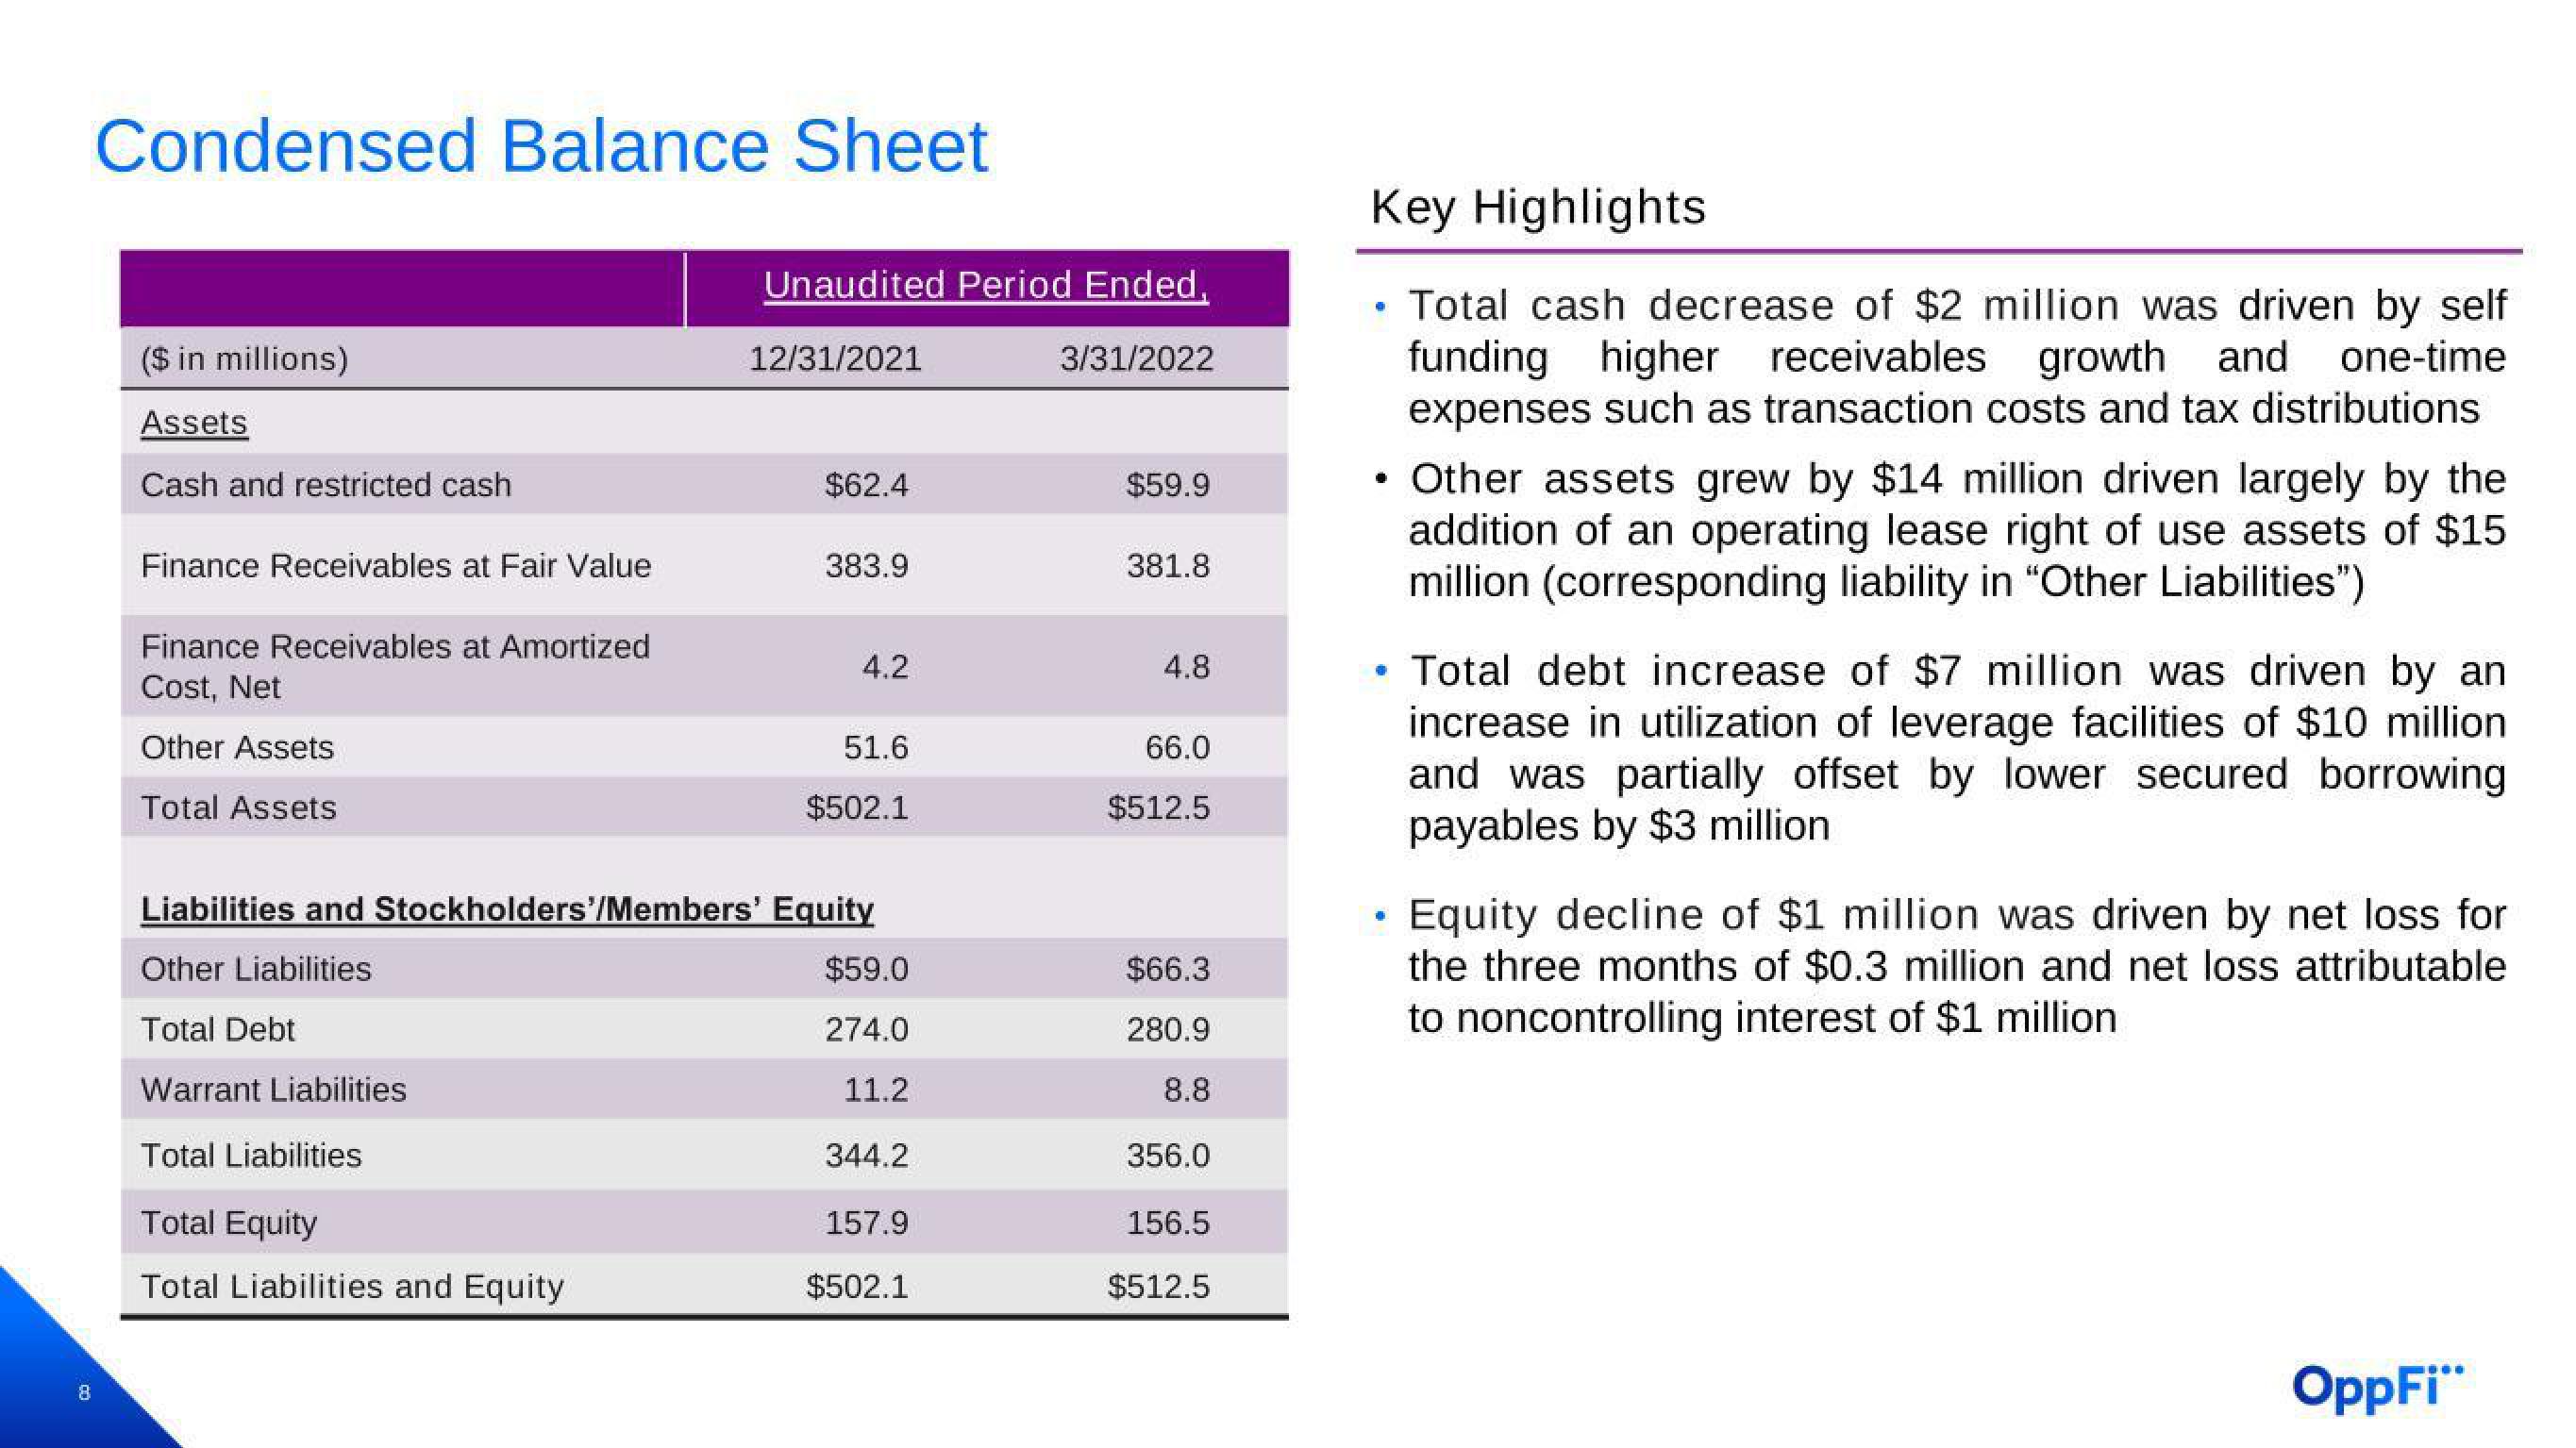
Total cash decrease of $2 million was driven by self
funding higher receivables growth and one-time
expenses such as transaction costs and tax distributions
•
• Other assets grew by $14 million driven largely by the
addition of an operating lease right of use assets of $15
million (corresponding liability in "Other Liabilities")
• Total debt increase of $7 million was driven by an
increase in utilization of leverage facilities of $10 million
and was partially offset by lower secured borrowing
payables by $3 million.
Equity decline of $1 million was driven by net loss for
the three months of $0.3 million and net loss attributable
to noncontrolling interest of $1 million
OppFi"View entire presentation