J.P.Morgan Results Presentation Deck
JPMORGAN CHASE & CO.
CONSUMER & COMMUNITY BANKING
FINANCIAL HIGHLIGHTS, CONTINUED
(in millions, except ratio data and where otherwise noted)
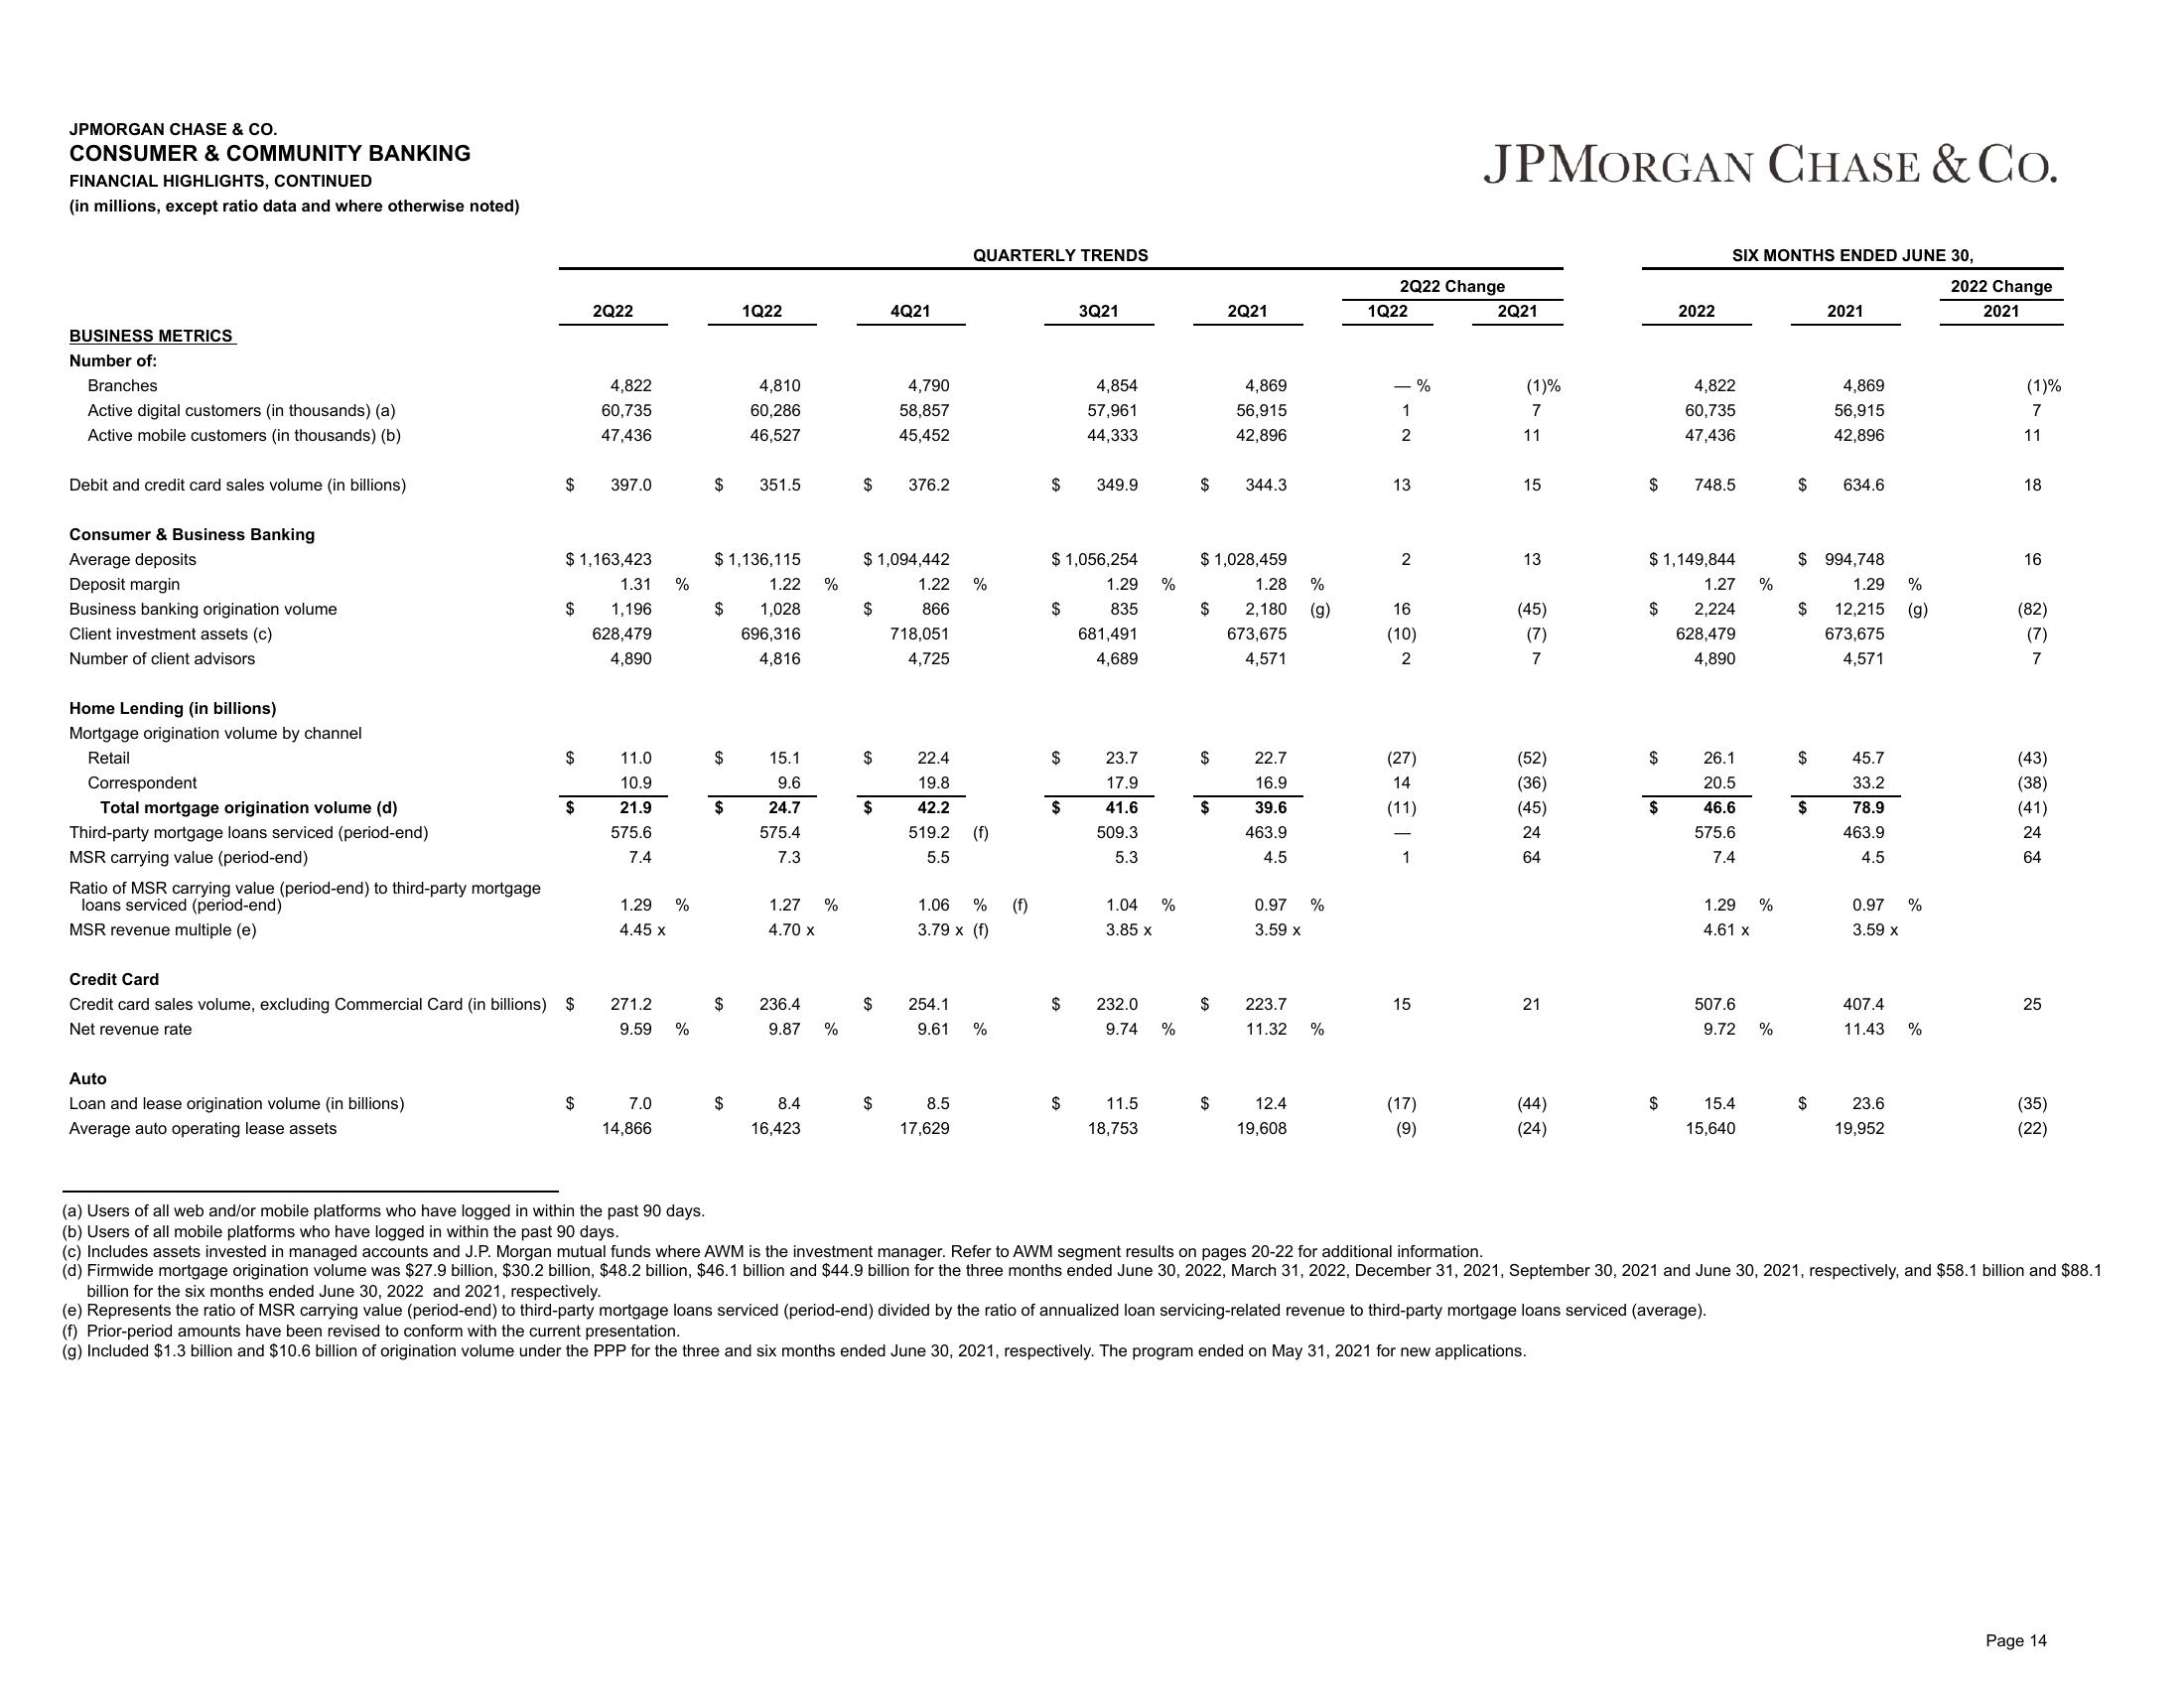
BUSINESS METRICS
Number of:
Branches
Active digital customers (in thousands) (a)
Active mobile customers (in thousands) (b)
Debit and credit card sales volume (in billions)
Consumer & Business Banking
Average deposits
Deposit margin
Business banking origination volume
Client investment assets (c)
Number of client advisors
Home Lending (in billions)
Mortgage origination volume by channel
Retail
Correspondent
Total mortgage origination volume (d)
Third-party mortgage loans serviced (period-end)
MSR carrying value (period-end)
Ratio of MSR carrying value (period-end) to third-party mortgage
loans serviced (period-end)
MSR revenue multiple (e)
$
Auto
Loan and lease origination volume (in billions)
Average auto operating lease assets
$
$
$ 1,163,423
$
Credit Card
Credit card sales volume, excluding Commercial Card (in billions) $
Net revenue rate
2Q22
$
4,822
60,735
47,436
397.0
1.31 %
1,196
628,479
4,890
11.0
10.9
21.9
575.6
7.4
1.29 %
4.45 x
271.2
9.59
7.0
14,866
%
$
$
$
$ 1,136,115
1.22
1,028
696,316
4,816
$
$
1Q22
$
4,810
60,286
46,527
351.5
15.1
9.6
24.7
575.4
7.3
1.27 %
4.70 X
236.4
%
9.87 %
8.4
16,423
$ 376.2
$
$ 1,094,442
$
4Q21
$
4,790
58,857
45,452
$
1.22 %
866
718,051
4,725
QUARTERLY TRENDS
22.4
19.8
42.2
519.2 (f)
5.5
1.06 % (f)
3.79 x (f)
254.1
9.61
8.5
17,629
%
$
$
$
$1,056,254
1.29
835
681,491
4,689
$
$
3Q21
$
4,854
57,961
44,333
349.9
23.7
17.9
41.6
509.3
5.3
1.04
3.85 x
232.0
9.74
11.5
18,753
%
%
%
$
$
$
$ 1,028,459
$
$
2Q21
$
4,869
56,915
42,896
344.3
%
1.28
2,180 (g)
673,675
4,571
22.7
16.9
39.6
463.9
4.5
0.97 %
3.59 x
223.7
11.32 %
12.4
19,608
2Q22 Change
1Q22
- %
1
2
13
2
16
(10)
2
(27)
14
(11)
1
1
15
JPMORGAN CHASE & Co.
(17)
(9)
2Q21
(1)%
7
11
15
13
(45)
(7)
7
(52)
(36)
(45)
24
64
21
(44)
(24)
$
(f) Prior-period amounts have been revised to conform with the current presentation.
(g) Included $1.3 billion and $10.6 billion of origination volume under the PPP for the three and six months ended June 30, 2021, respectively. The program ended on May 31, 2021 for new applications.
$
$
$
2022
$ 1,149,844
1.27
2,224
628,479
4,890
$
SIX MONTHS ENDED JUNE 30,
4,822
60,735
47,436
748.5
26.1
20.5
46.6
575.6
7.4
1.29
4.61 x
507.6
9.72
15.4
15,640
%
%
%
$
$
$
$ 994,748
$
2021
$
4,869
56,915
42,896
634.6
1.29 %
12,215
673,675
4,571
45.7
33.2
78.9
463.9
4.5
0.97
3.59 x
407.4
11.43
23.6
19,952
(g)
%
%
2022 Change
2021
(1)%
7
11
18
16
(82)
(7)
7
(43)
(38)
(41)
24
64
25
(35)
(22)
(a) Users of all web and/or mobile platforms who have logged in within the past 90 days.
(b) Users of all mobile platforms who have logged in within the past 90 days.
(c) Includes assets invested in managed accounts and J.P. Morgan mutual funds where AWM is the investment manager. Refer to AWM segment results on pages 20-22 for additional information.
(d) Firmwide mortgage origination volume was $27.9 billion, $30.2 billion, $48.2 billion, $46.1 billion and $44.9 billion for the three months ended June 30, 2022, March 31, 2022, December 31, 2021, September 30, 2021 and June 30, 2021, respectively, and $58.1 billion and $88.1
billion for the six months ended June 30, 2022 and 2021, respectively.
(e) Represents the ratio of MSR carrying value (period-end) to third-party mortgage loans serviced (period-end) divided by the ratio of annualized loan servicing-related revenue to third-party mortgage loans serviced (average).
Page 14View entire presentation