Tronox Investor Presentation
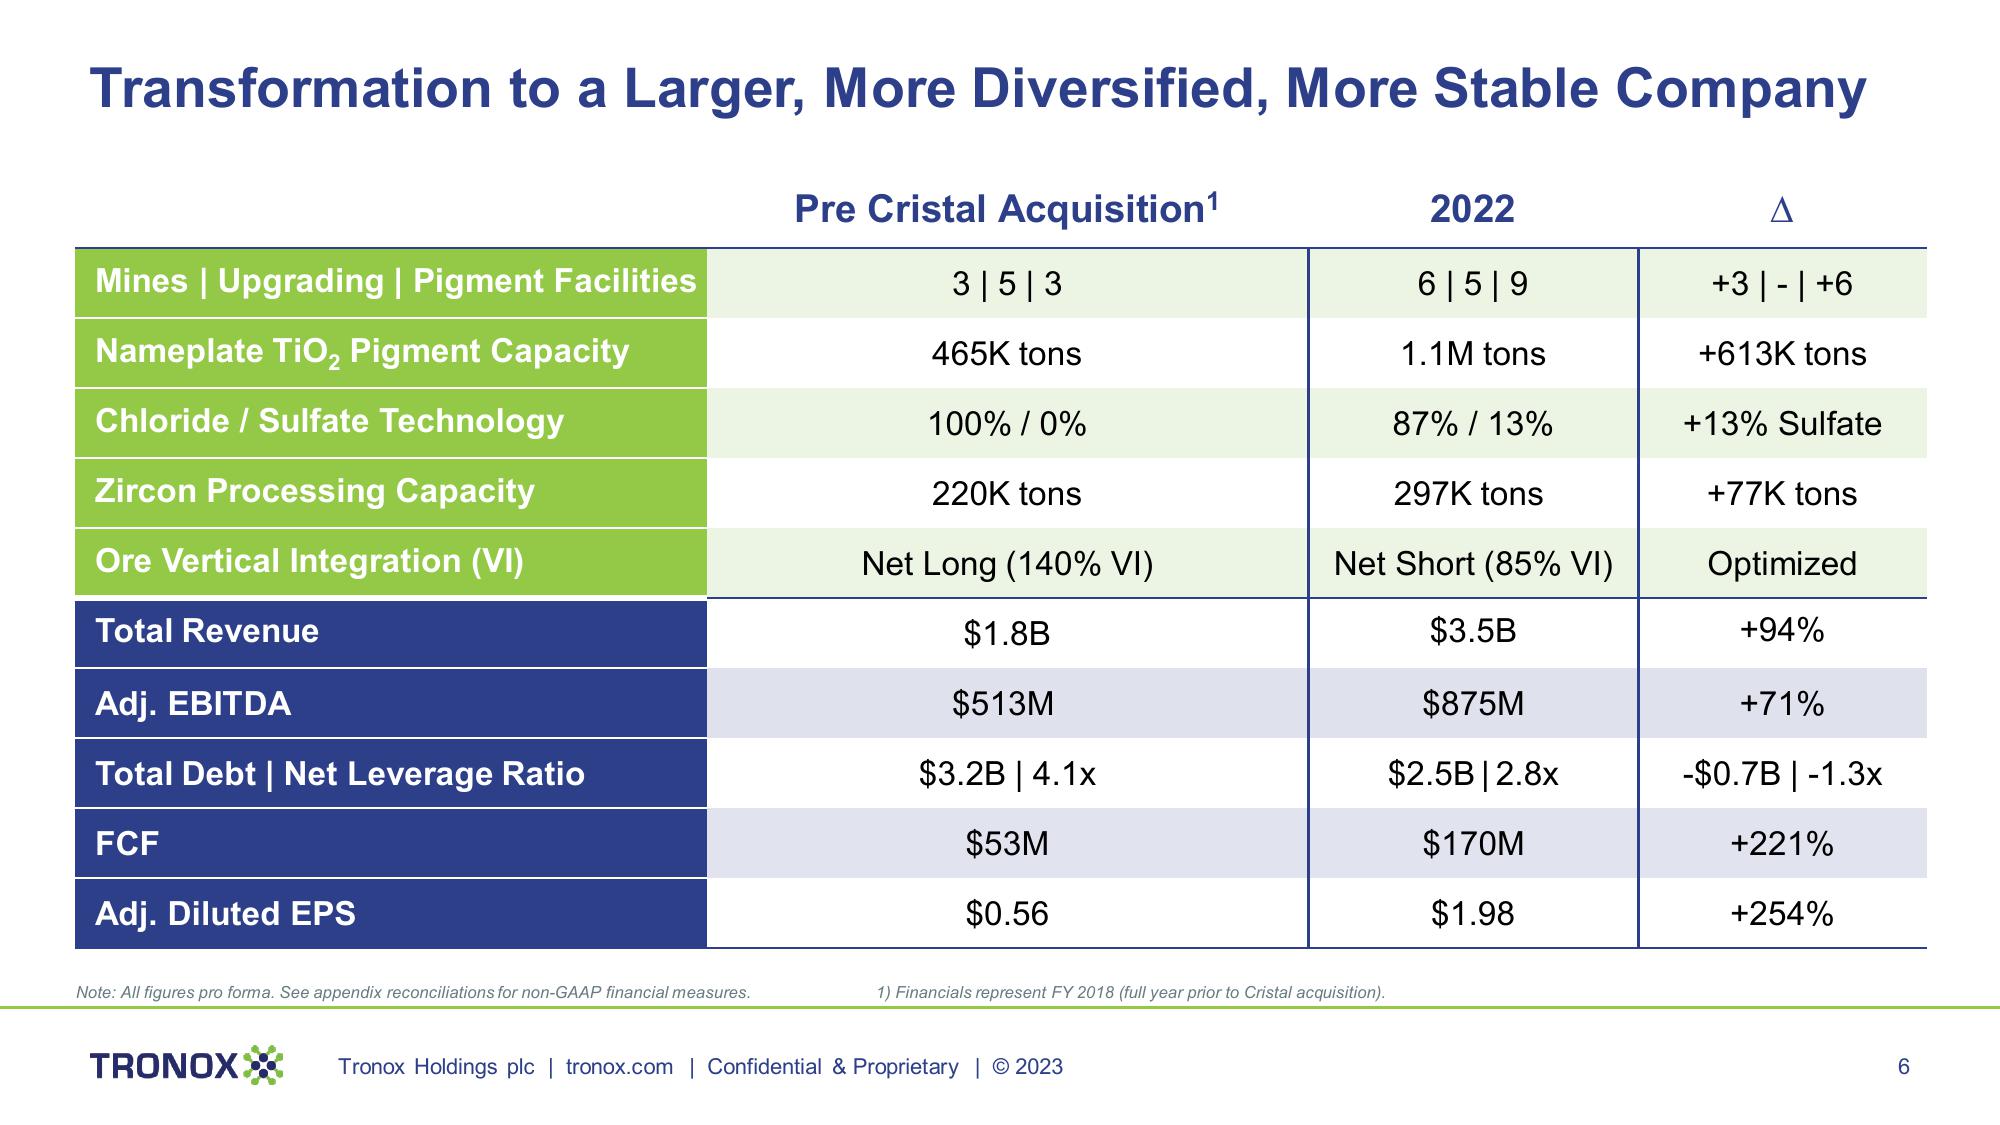
Transformation to a Larger, More Diversified, More Stable Company
Pre Cristal Acquisition¹
Mines | Upgrading | Pigment Facilities
Nameplate TiO₂ Pigment Capacity
2
Chloride / Sulfate Technology
Zircon Processing Capacity
Ore Vertical Integration (VI)
Total Revenue
Adj. EBITDA
Total Debt | Net Leverage Ratio
FCF
Adj. Diluted EPS
Note: All figures pro forma. See appendix reconciliations for non-GAAP financial measures.
TRONOXX
3|5|3
465K tons
100% / 0%
220K tons
Net Long (140% VI)
$1.8B
$513M
$3.2B | 4.1x
$53M
$0.56
1) Financials represent FY 2018 (full year prior to Cristal acquisition).
Tronox Holdings plc | tronox.com | Confidential & Proprietary | © 2023
2022
6|5|9
1.1M tons
87% / 13%
297K tons
Net Short (85% VI)
$3.5B
$875M
$2.5B|2.8x
$170M
$1.98
A
+3|-| +6
+613K tons
+13% Sulfate
+77K tons
Optimized
+94%
+71%
-$0.7B | -1.3x
+221%
+254%
6View entire presentation