Navitas SPAC Presentation Deck
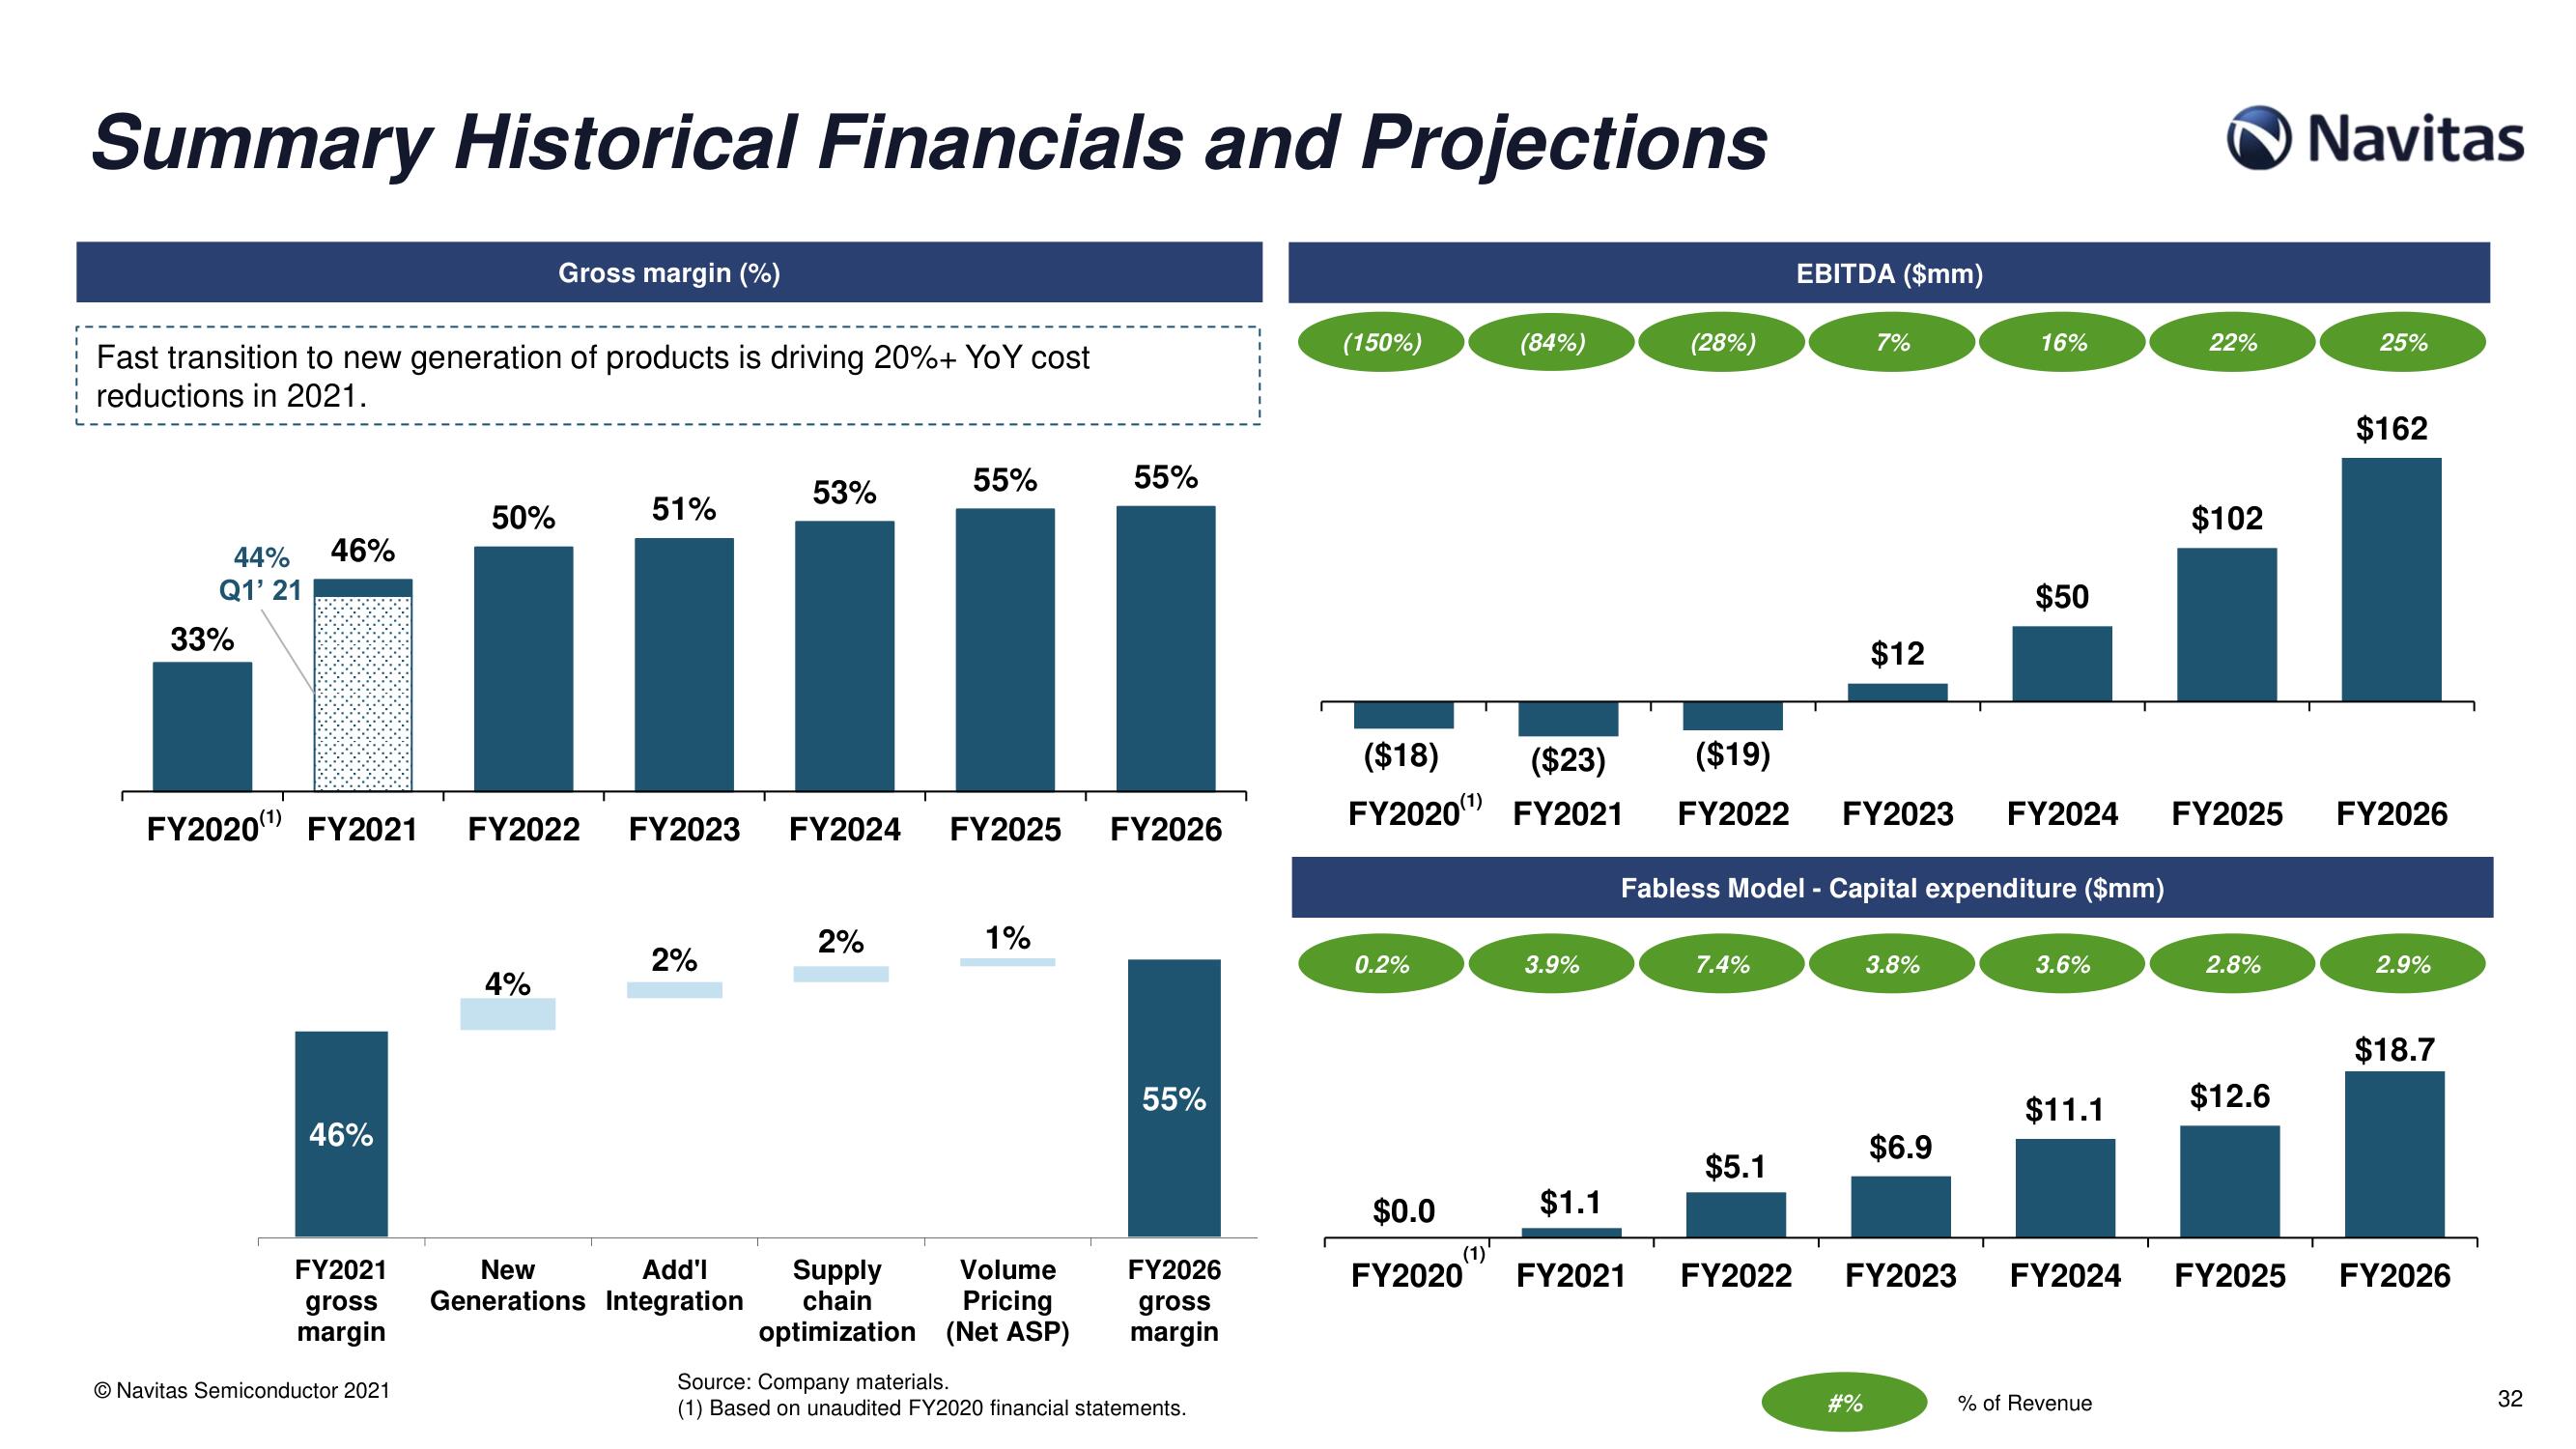
Summary Historical Financials and Projections
Fast transition to new generation of products is driving 20%+ YoY cost
reductions in 2021.
44% 46%
Q1' 21
33%
FY2020¹) FY2021
46%
FY2021
gross
margin
O Navitas Semiconductor 2021
50%
Gross margin (%)
4%
51%
FY2022 FY2023
2%
Add'l
New
Generations Integration
I
53%
55%
FY2024 FY2025
2%
1%
Supply Volume
chain Pricing
optimization (Net ASP)
T
55%
FY2026
55%
FY2026
gross
margin
Source: Company materials.
(1) Based on unaudited FY2020 financial statements.
(150%)
0.2%
($18) ($23) ($19)
FY2020¹ FY2021
$0.0
FY2020
(84%)
(1)
3.9%
$1.1
(28%)
FY2021
7.4%
EBITDA ($mm)
$5.1
FY2022
7%
Fabless Model - Capital expenditure ($mm)
$12
FY2022 FY2023 FY2024 FY2025
#%
3.8%
16%
$6.9
FY2023
$50
3.6%
$11.1
FY2024
22%
% of Revenue
$102
2.8%
$12.6
Navitas
25%
$162
FY2026
2.9%
$18.7
FY2025 FY2026
32View entire presentation