Fiverr Investor Presentation Deck
Q2'19
key results
fiverr
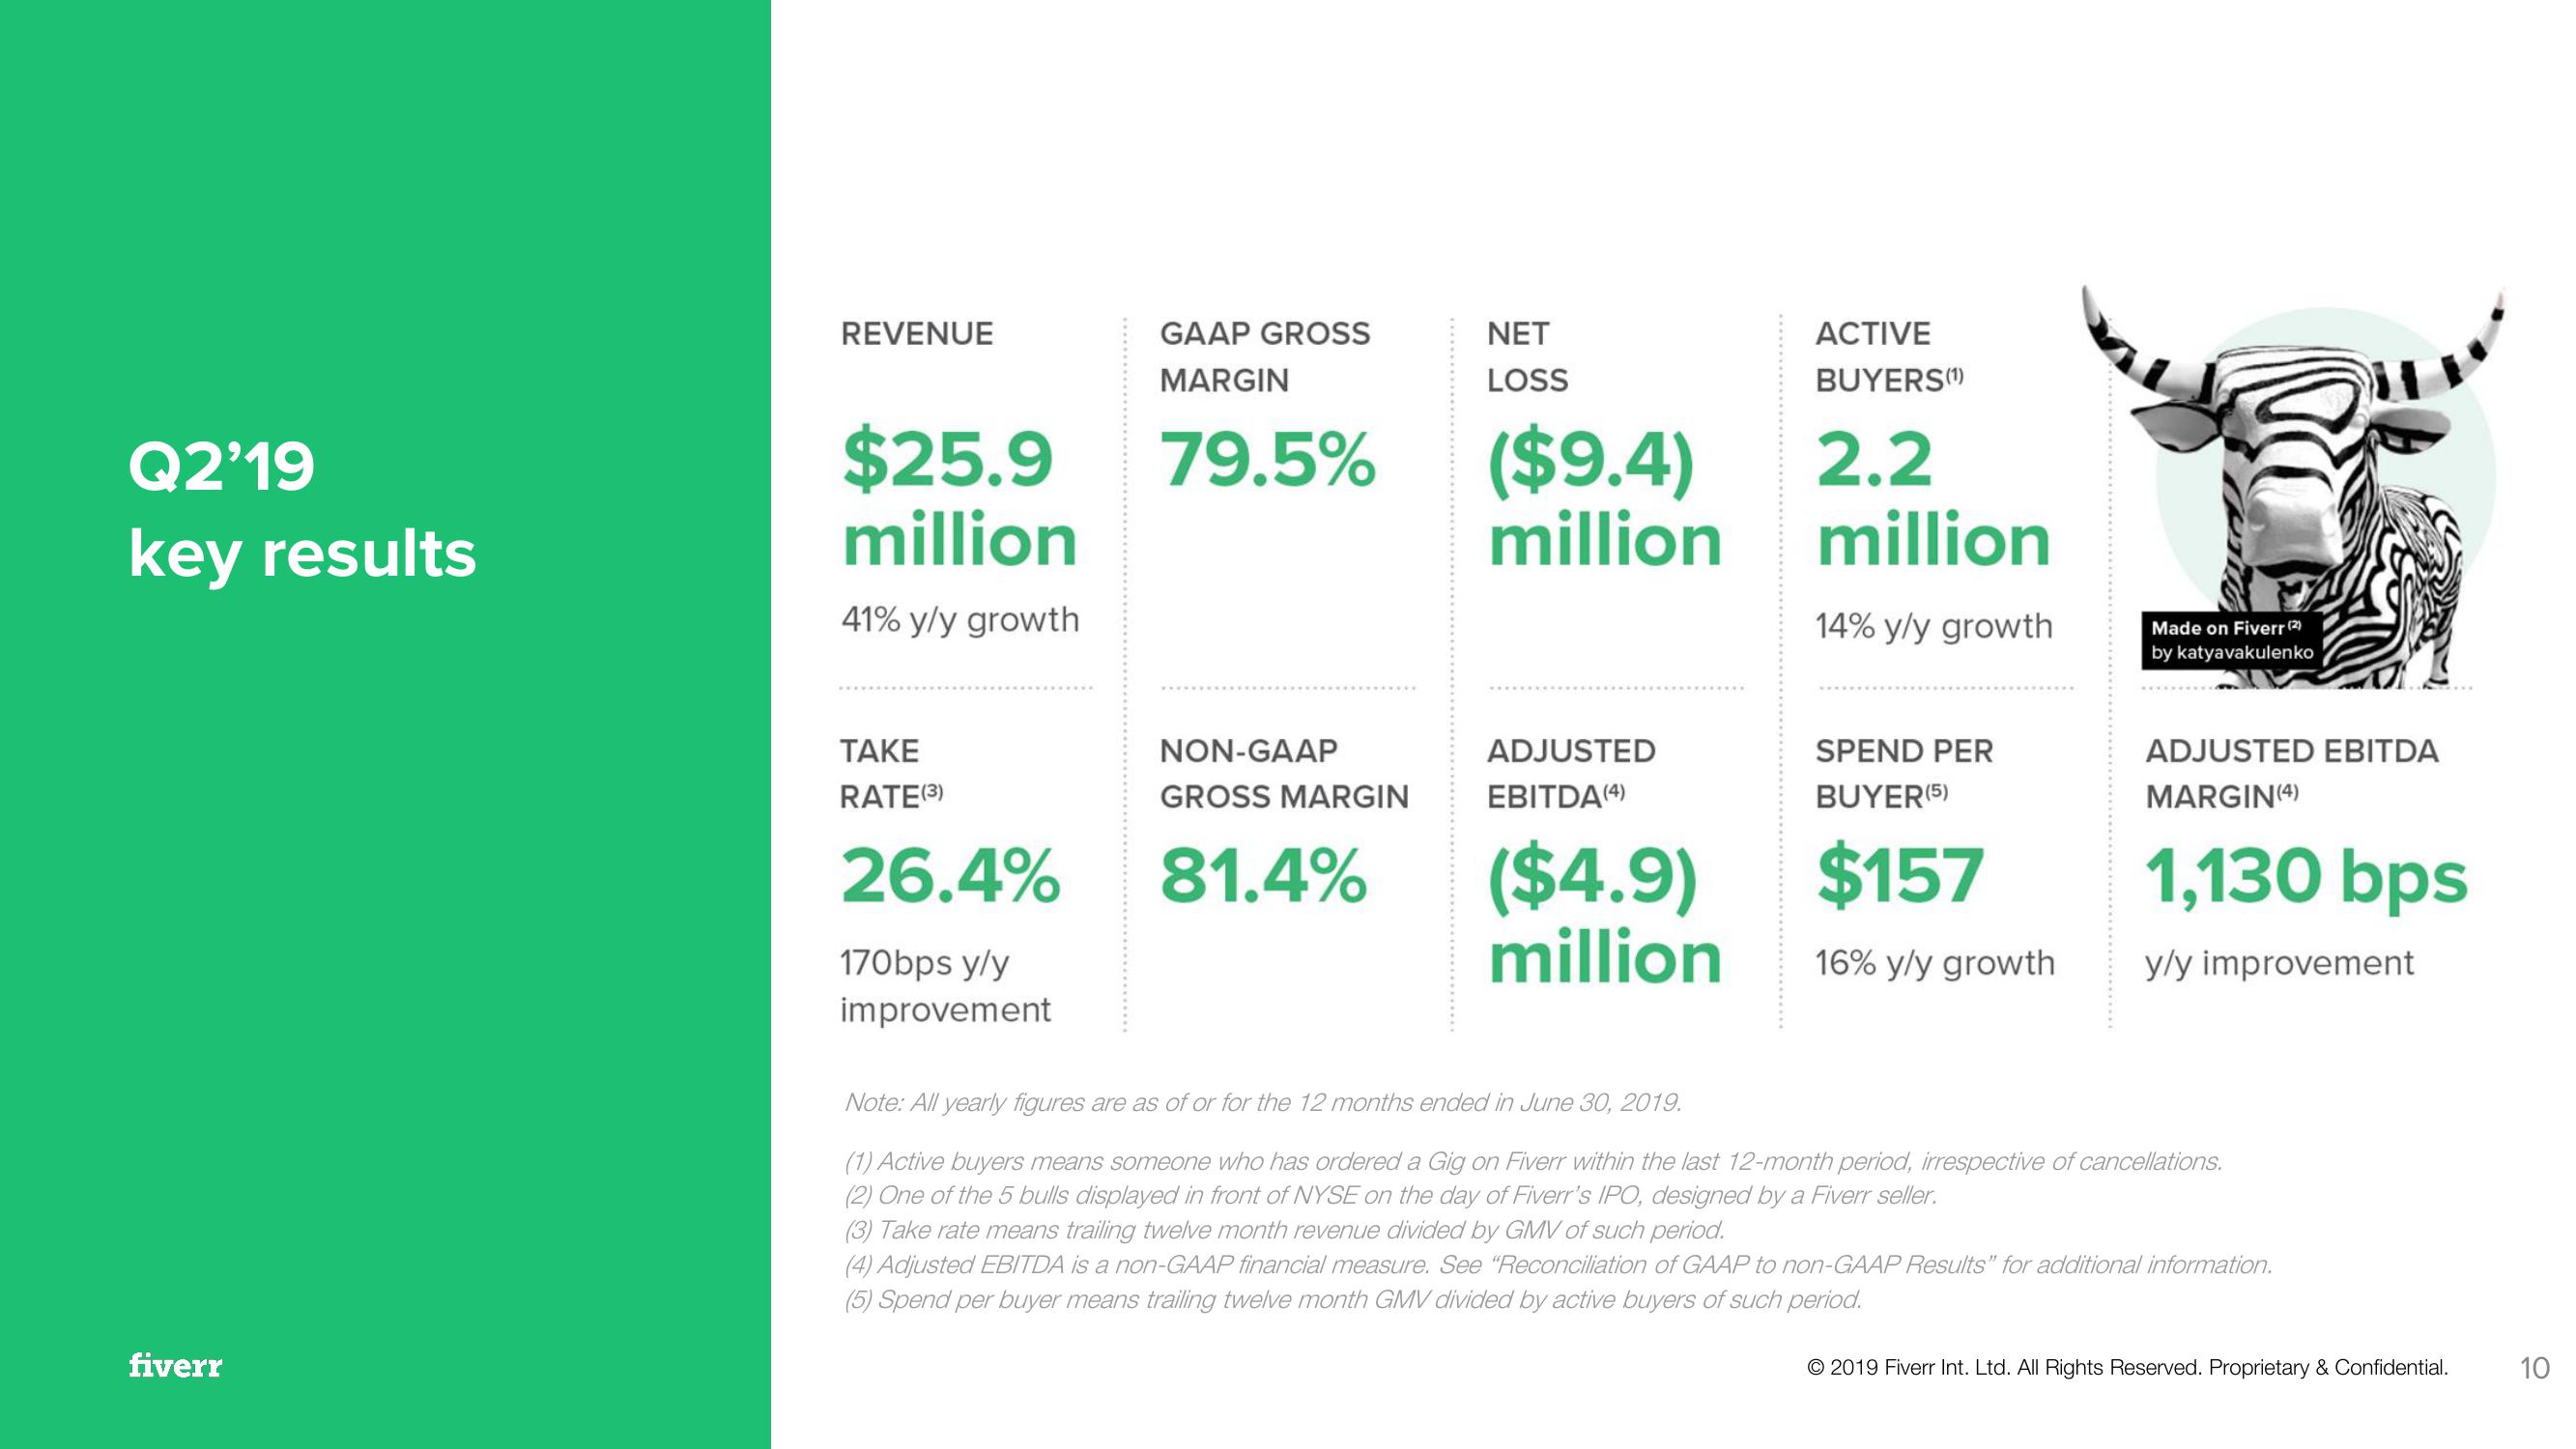
REVENUE
$25.9
million
41% y/y growth
TAKE
RATE (3)
26.4%
170bps y/y
improvement
GAAP GROSS
MARGIN
79.5%
NON-GAAP
GROSS MARGIN
81.4%
NET
LOSS
($9.4)
million
ADJUSTED
EBITDA (4)
($4.9)
million
ACTIVE
BUYERS(¹)
2.2
million
14% y/y growth
SPEND PER
BUYER (5)
$157
16% y/y growth
Made on Fiverr (2)
by katyavakulenko
ADJUSTED EBITDA
MARGIN (4)
1,130 bps
y/y improvement
Note: All yearly figures are as of or for the 12 months ended in June 30, 2019.
(1) Active buyers means someone who has ordered a Gig on Fiverr within the last 12-month period, irrespective of cancellations.
(2) One of the 5 bulls displayed in front of NYSE on the day of Fiverr's IPO, designed by a Fiverr seller.
(3) Take rate means trailing twelve month revenue divided by GMV of such period.
(4) Adjusted EBITDA is a non-GAAP financial measure. See "Reconciliation of GAAP to non-GAAP Results" for additional information.
(5) Spend per buyer means trailing twelve month GMV divided by active buyers of such period.
© 2019 Fiverr Int. Ltd. All Rights Reserved. Proprietary & Confidential.
10View entire presentation