Pathward Financial Results Presentation Deck
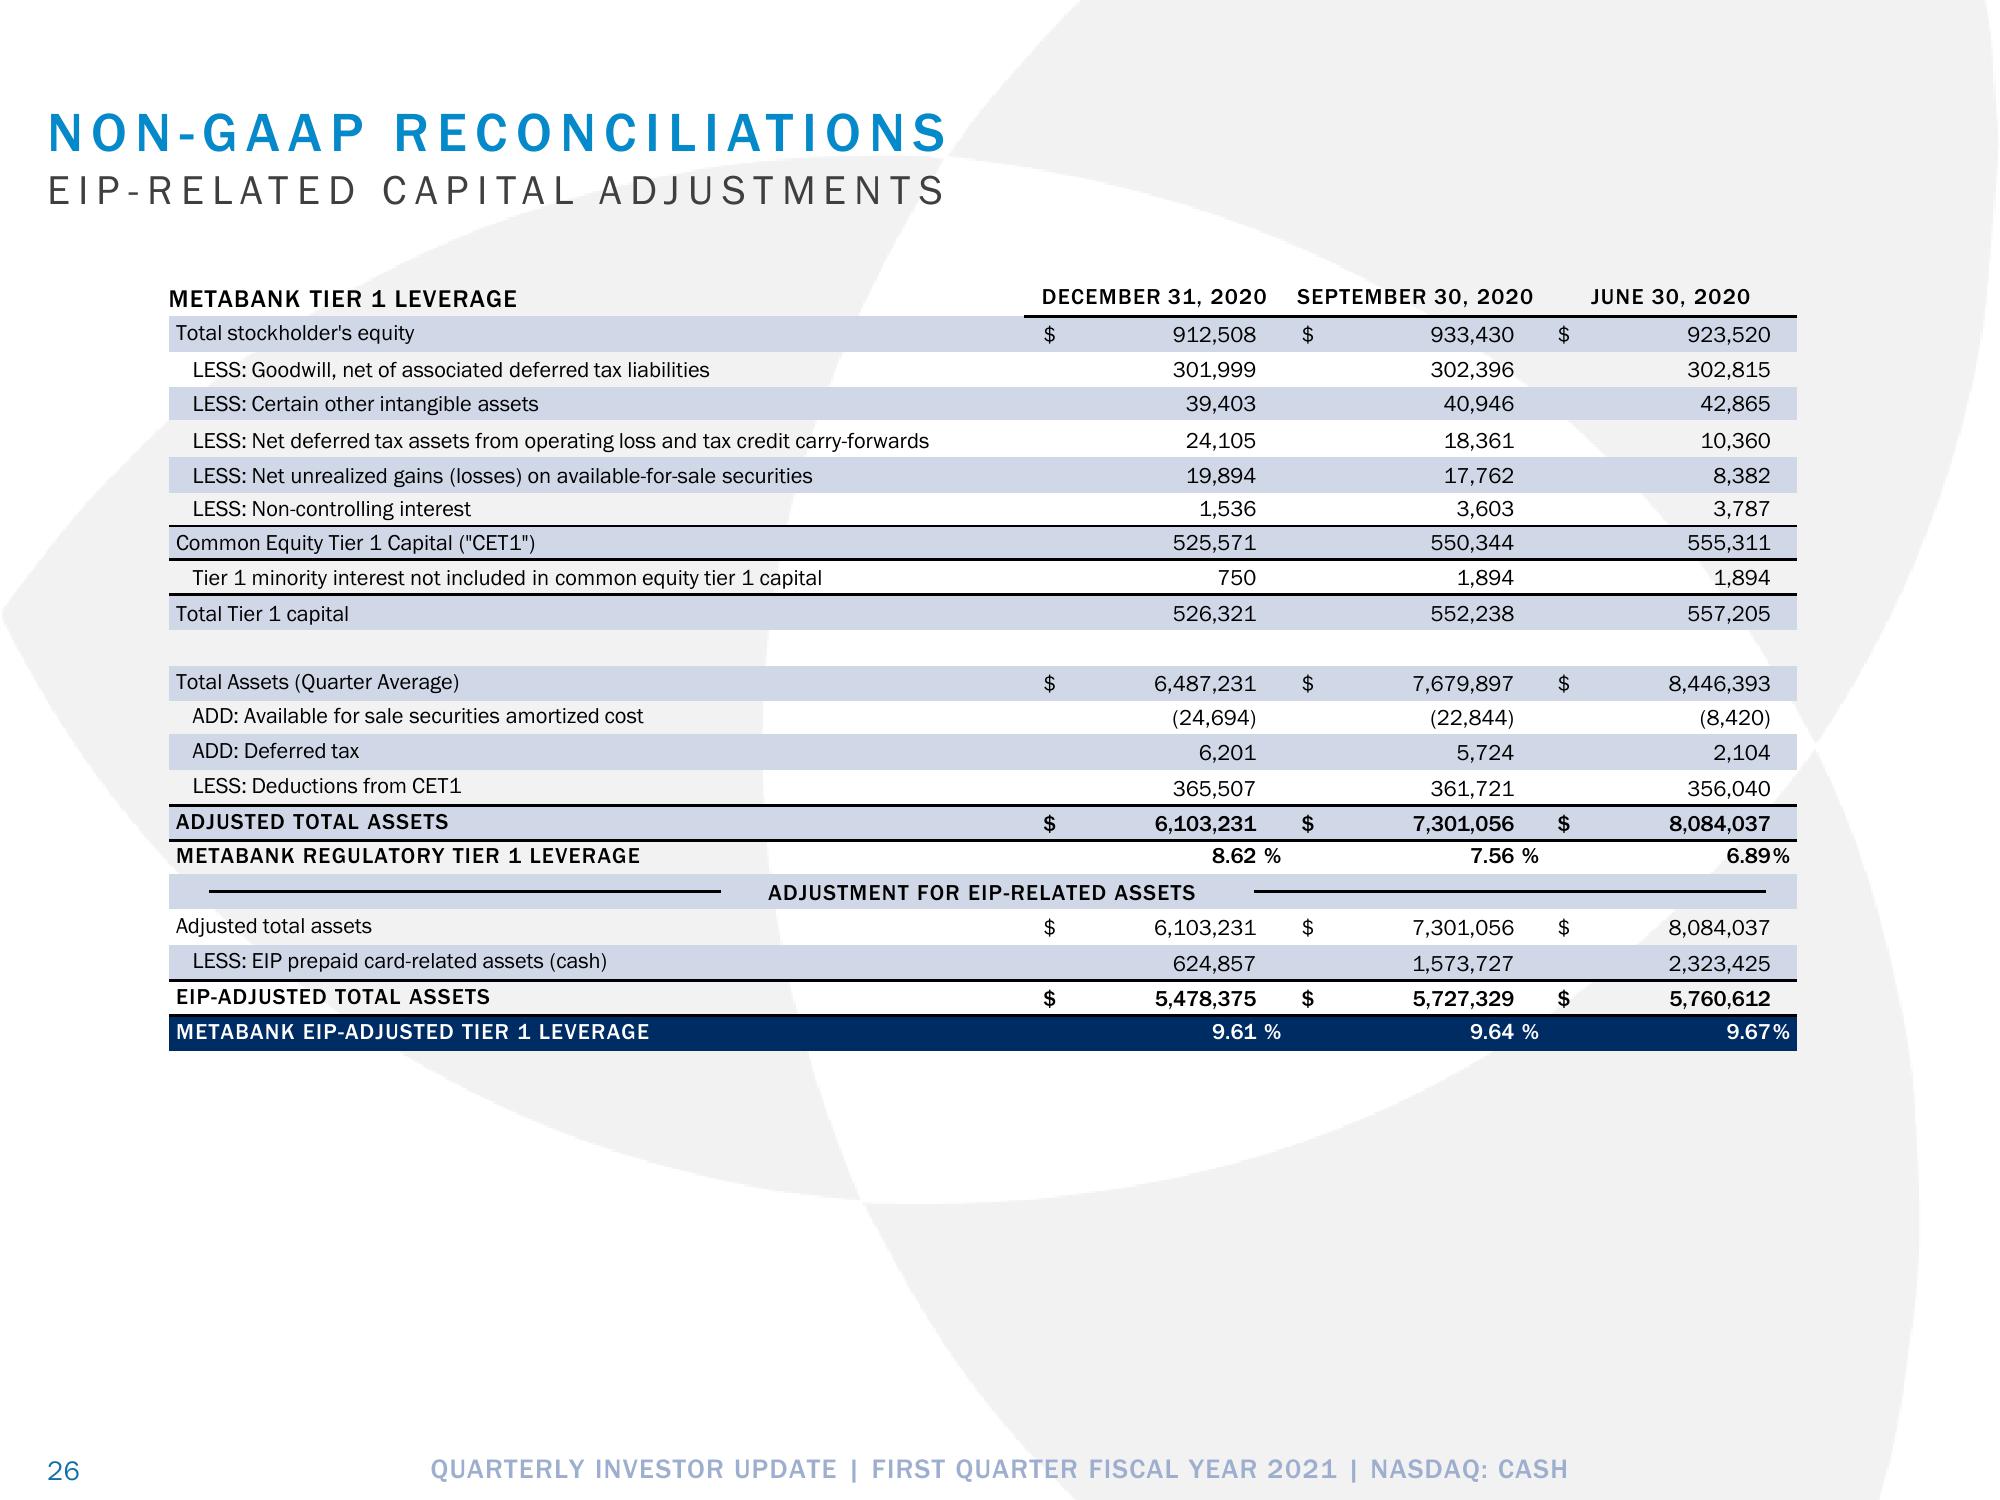
NON-GAAP RECONCILIATIONS
EIP-RELATED CAPITAL ADJUSTMENTS
26
METABANK TIER 1 LEVERAGE
Total stockholder's equity
LESS: Goodwill, net of associated deferred tax liabilities
LESS: Certain other intangible assets
LESS: Net deferred tax assets from operating loss and tax credit carry-forwards
LESS: Net unrealized gains (losses) on available-for-sale securities
LESS: Non-controlling interest
Common Equity Tier 1 Capital ("CET1")
Tier 1 minority interest not included in common equity tier 1 capital
Total Tier 1 capital
Total Assets (Quarter Average)
ADD: Available for sale securities amortized cost
ADD: Deferred tax
LESS: Deductions from CET1
ADJUSTED TOTAL ASSETS
METABANK REGULATORY TIER 1 LEVERAGE
Adjusted total assets
LESS: EIP prepaid card-related assets (cash)
EIP-ADJUSTED TOTAL ASSETS
METABANK EIP-ADJUSTED TIER 1 LEVERAGE
DECEMBER 31, 2020 SEPTEMBER 30, 2020
912,508
933,430
301,999
302,396
39,403
40,946
24,105
19,894
1,536
525,571
750
526,321
$
$
$
6,487,231
(24,694)
6,201
365,507
6,103,231
8.62 %
ADJUSTMENT FOR EIP-RELATED ASSETS
$
$
$
$
$
6,103,231 $
624,857
5,478,375 $
9.61 %
18,361
17,762
3,603
550,344
1,894
552,238
7,679,897
(22,844)
5,724
361,721
7,301,056
7.56 %
$
$
$
7,301,056 $
1,573,727
5,727,329 $
9.64 %
QUARTERLY INVESTOR UPDATE | FIRST QUARTER FISCAL YEAR 2021 | NASDAQ: CASH
JUNE 30, 2020
923,520
302,815
42,865
10,360
8,382
3,787
555,311
1,894
557,205
8,446,393
(8,420)
2,104
356,040
8,084,037
6.89%
8,084,037
2,323,425
5,760,612
9.67%View entire presentation