Main Street Capital Investor Day Presentation Deck
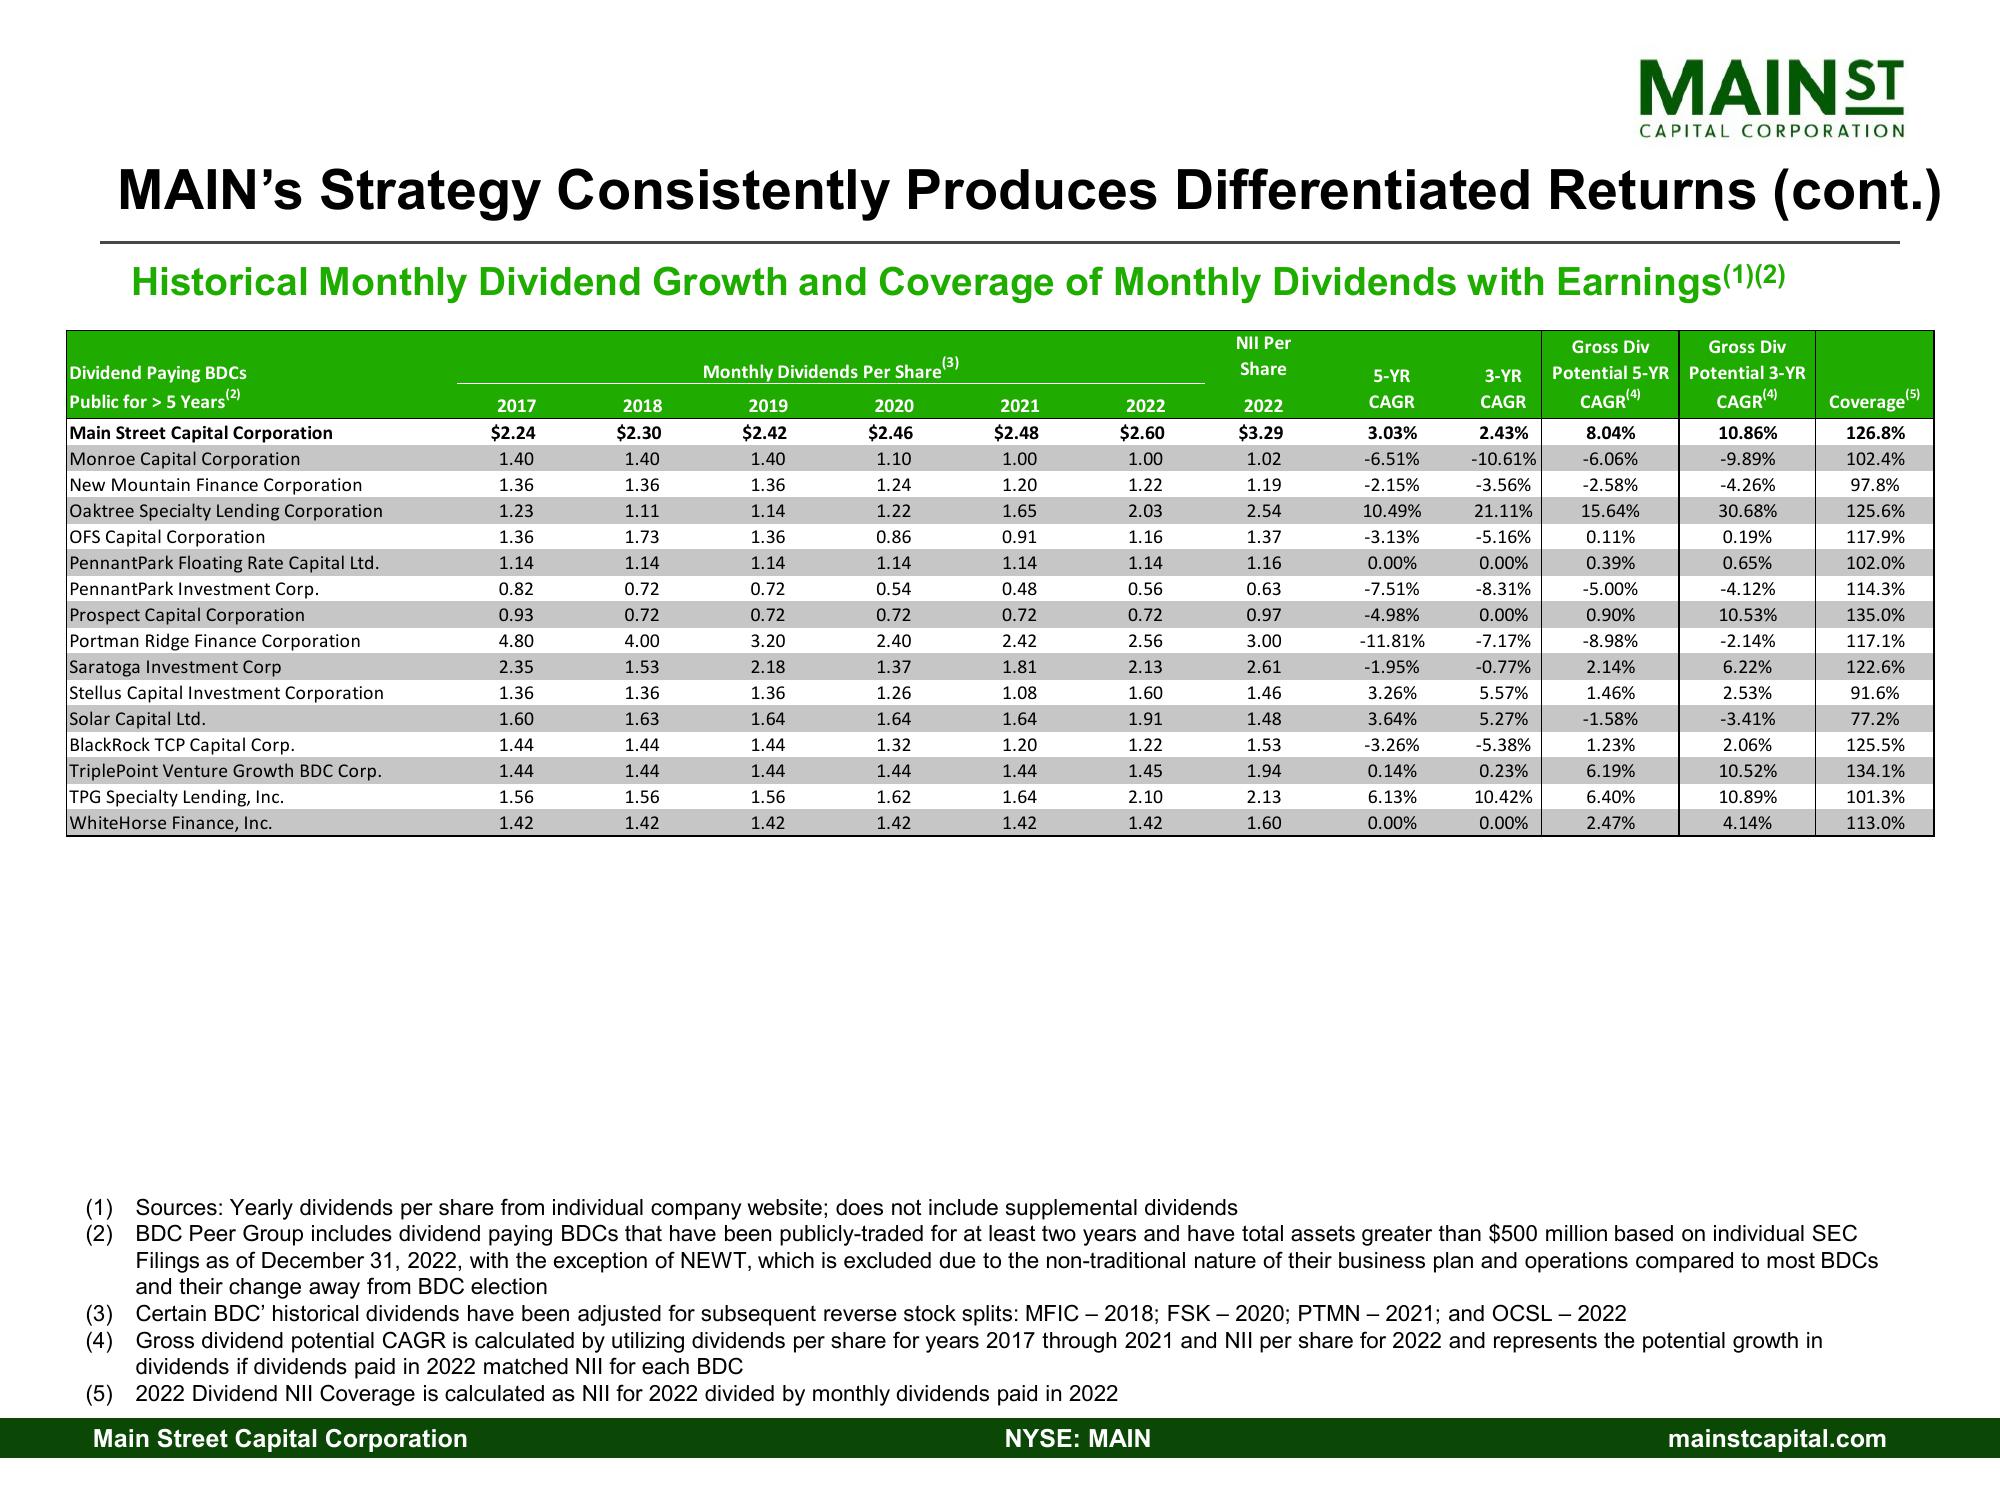
MAIN's Strategy Consistently Produces Differentiated Returns (cont.)
Dividend Paying BDCs
Public for > 5 Years (2)
Main Street Capital Corporation
Monroe Capital Corporation
New Mountain Finance Corporation
Oaktree Specialty Lending Corporation
OFS Capital Corporation
Pennant Park Floating Rate Capital Ltd.
PennantPark Investment Corp.
Prospect Capital Corporation
Portman Ridge Finance Corporation
Saratoga Investment Corp
Stellus Capital Investment Corporation
Solar Capital Ltd.
Historical Monthly Dividend Growth and Coverage of Monthly Dividends with Earnings (1)(2)
Gross Div
Potential 5-YR
CAGR(4)
Gross Div
Potential 3-YR
CAGR (4)
10.86%
-9.89%
-4.26%
30.68%
0.19%
0.65%
-4.12%
10.53%
-2.14%
6.22%
2.53%
-3.41%
2.06%
10.52%
10.89%
4.14%
BlackRock TCP Capital Corp.
TriplePoint Venture Growth BDC Corp.
TPG Specialty Lending, Inc.
WhiteHorse Finance, Inc.
2017
$2.24
1.40
1.36
1.23
1.36
1.14
0.82
0.93
4.80
2.35
1.36
1.60
1.44
1.44
1.56
1.42
2018
$2.30
1.40
1.36
1.11
1.73
1.14
0.72
0.72
4.00
1.53
1.36
1.63
1.44
1.44
1.56
1.42
Monthly Dividends Per Share (3)
2020
$2.46
1.10
1.24
1.22
0.86
1.14
0.54
0.72
2.40
1.37
1.26
1.64
1.32
2019
$2.42
1.40
1.36
1.14
1.36
1.14
0.72
0.72
3.20
2.18
1.36
1.64
1.44
1.44
1.56
1.42
1.44
1.62
1.42
2021
$2.48
1.00
1.20
1.65
0.91
1.14
0.48
0.72
2.42
1.81
1.08
1.64
1.20
1.44
1.64
1.42
2022
$2.60
1.00
1.22
2.03
1.16
1.14
0.56
0.72
2.56
2.13
1.60
1.91
1.22
1.45
2.10
1.42
NII Per
Share
2022
$3.29
1.02
1.19
2.54
1.37
1.16
0.63
0.97
3.00
2.61
1.46
1.48
1.53
1.94
2.13
1.60
5-YR
CAGR
3.03%
-6.51%
-2.15%
10.49%
-3.13%
0.00%
-7.51%
-4.98%
-11.81%
-1.95%
3.26%
3.64%
-3.26%
0.14%
6.13%
0.00%
MAIN ST
3-YR
CAGR
2.43%
-10.61%
-3.56%
21.11%
-5.16%
0.00%
-8.31%
0.00%
-7.17%
-0.77%
5.57%
5.27%
-5.38%
0.23%
10.42%
0.00%
CAPITAL CORPORATION
-1.58%
1.23%
6.19%
6.40%
2.47%
8.04%
-6.06%
-2.58%
15.64%
0.11%
0.39%
-5.00%
0.90%
-8.98%
2.14%
1.46%
(3) Certain BDC' historical dividends have been adjusted for subsequent reverse stock splits: MFIC - 2018; FSK - 2020; PTMN - 2021; and OCSL - 2022
(4) Gross dividend potential CAGR is calculated by utilizing dividends per share for years 2017 through 2021 and NII per share for 2022 and represents the potential growth in
dividends if dividends paid in 2022 matched NII for each BDC
(5) 2022 Dividend NII Coverage is calculated as NII for 2022 divided by monthly dividends paid in 2022
Main Street Capital Corporation
NYSE: MAIN
Coverage
126.8%
102.4%
97.8%
125.6%
117.9%
102.0%
114.3%
(1) Sources: Yearly dividends per share from individual company website; does not include supplemental dividends
BDC Peer Group includes dividend paying BDCs that have been publicly-traded for at least two years and have total assets greater than $500 million based on individual SEC
Filings as of December 31, 2022, with the exception of NEWT, which is excluded due to the non-traditional nature of their business plan and operations compared to most BDCS
and their change away from BDC electic
(5)
135.0%
117.1%
122.6%
91.6%
77.2%
125.5%
134.1%
101.3%
113.0%
mainstcapital.comView entire presentation