Digerati SPAC Presentation Deck
Financial Highlights
1.
2.
3.
Year End Revenues
$20,000
$15,000
$10,000
$5,000
$0
$2,001
Revenue
2018
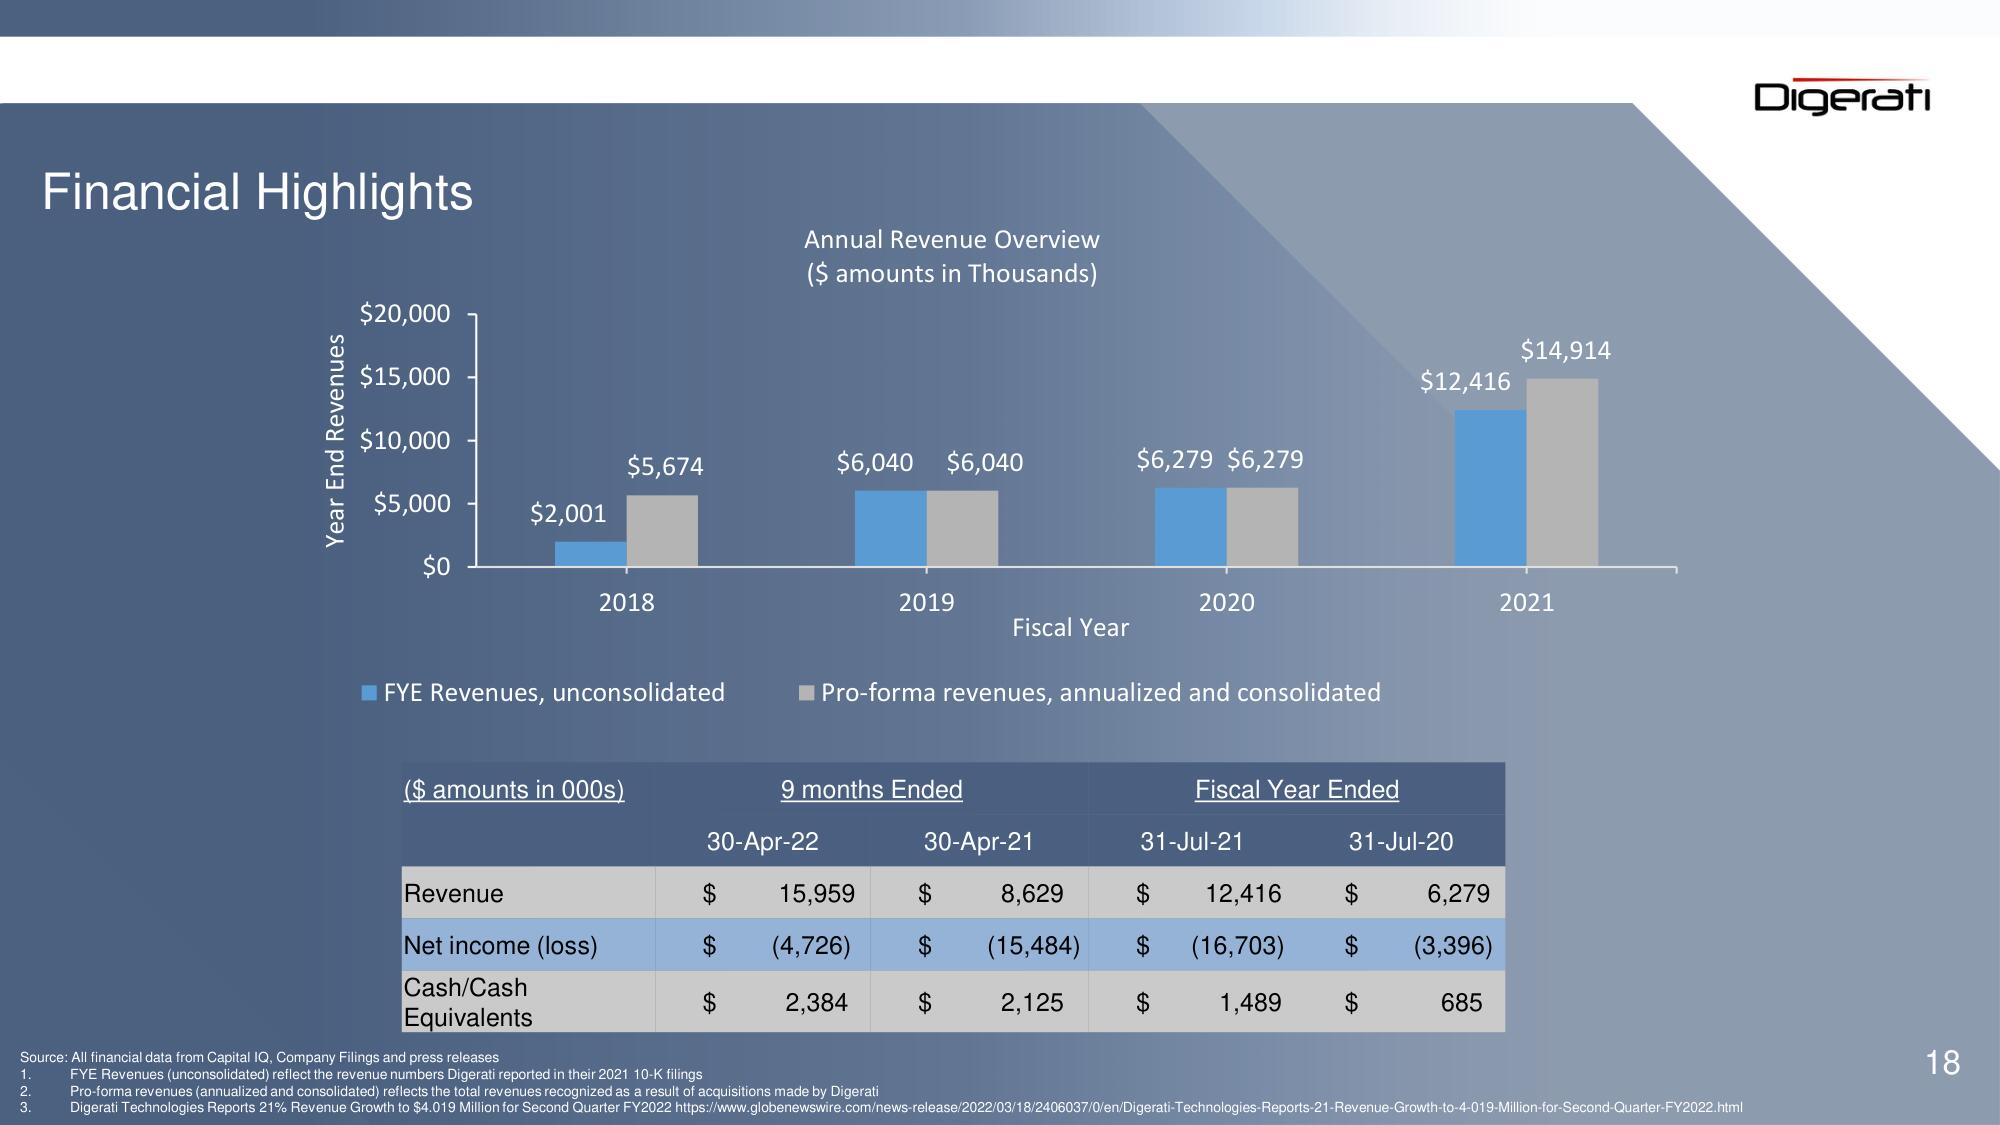
FYE Revenues, unconsolidated
($ amounts in 000s)
$5,674
Net income (loss)
Cash/Cash
Equivalents
Annual Revenue Overview
($ amounts in Thousands)
$
30-Apr-22
$6,040 $6,040
2019
9 months Ended
Fiscal Year
Pro-forma revenues, annualized and consolidated
30-Apr-21
15,959 $
(4,726) $
2,384
$6,279 $6,279
8,629
(15,484)
2,125
2020
Fiscal Year Ended
31-Jul-21
$ 12,416
$ (16,703)
$
1,489
$12,416
31-Jul-20
$
$
6,279
(3,396)
685
$14,914
2021
Source: All financial data from Capital IQ, Company Filings and press releases
FYE Revenues (unconsolidated) reflect the revenue numbers Digerati reported in their 2021 10-K filings
Pro-forma revenues (annualized and consolidated) reflects the total revenues recognized as a result of acquisitions made by Digerati
Digerati Technologies Reports 21% Revenue Growth to $4.019 Million for Second Quarter FY2022 https://www.globenewswire.com/news-release/2022/03/18/2406037/0/en/Digerati-Technologies-Reports-21-Revenue-Growth-to-4-019-Million-for-Second-Quarter-FY2022.html
Digerati
18View entire presentation