Tuya Results Presentation Deck
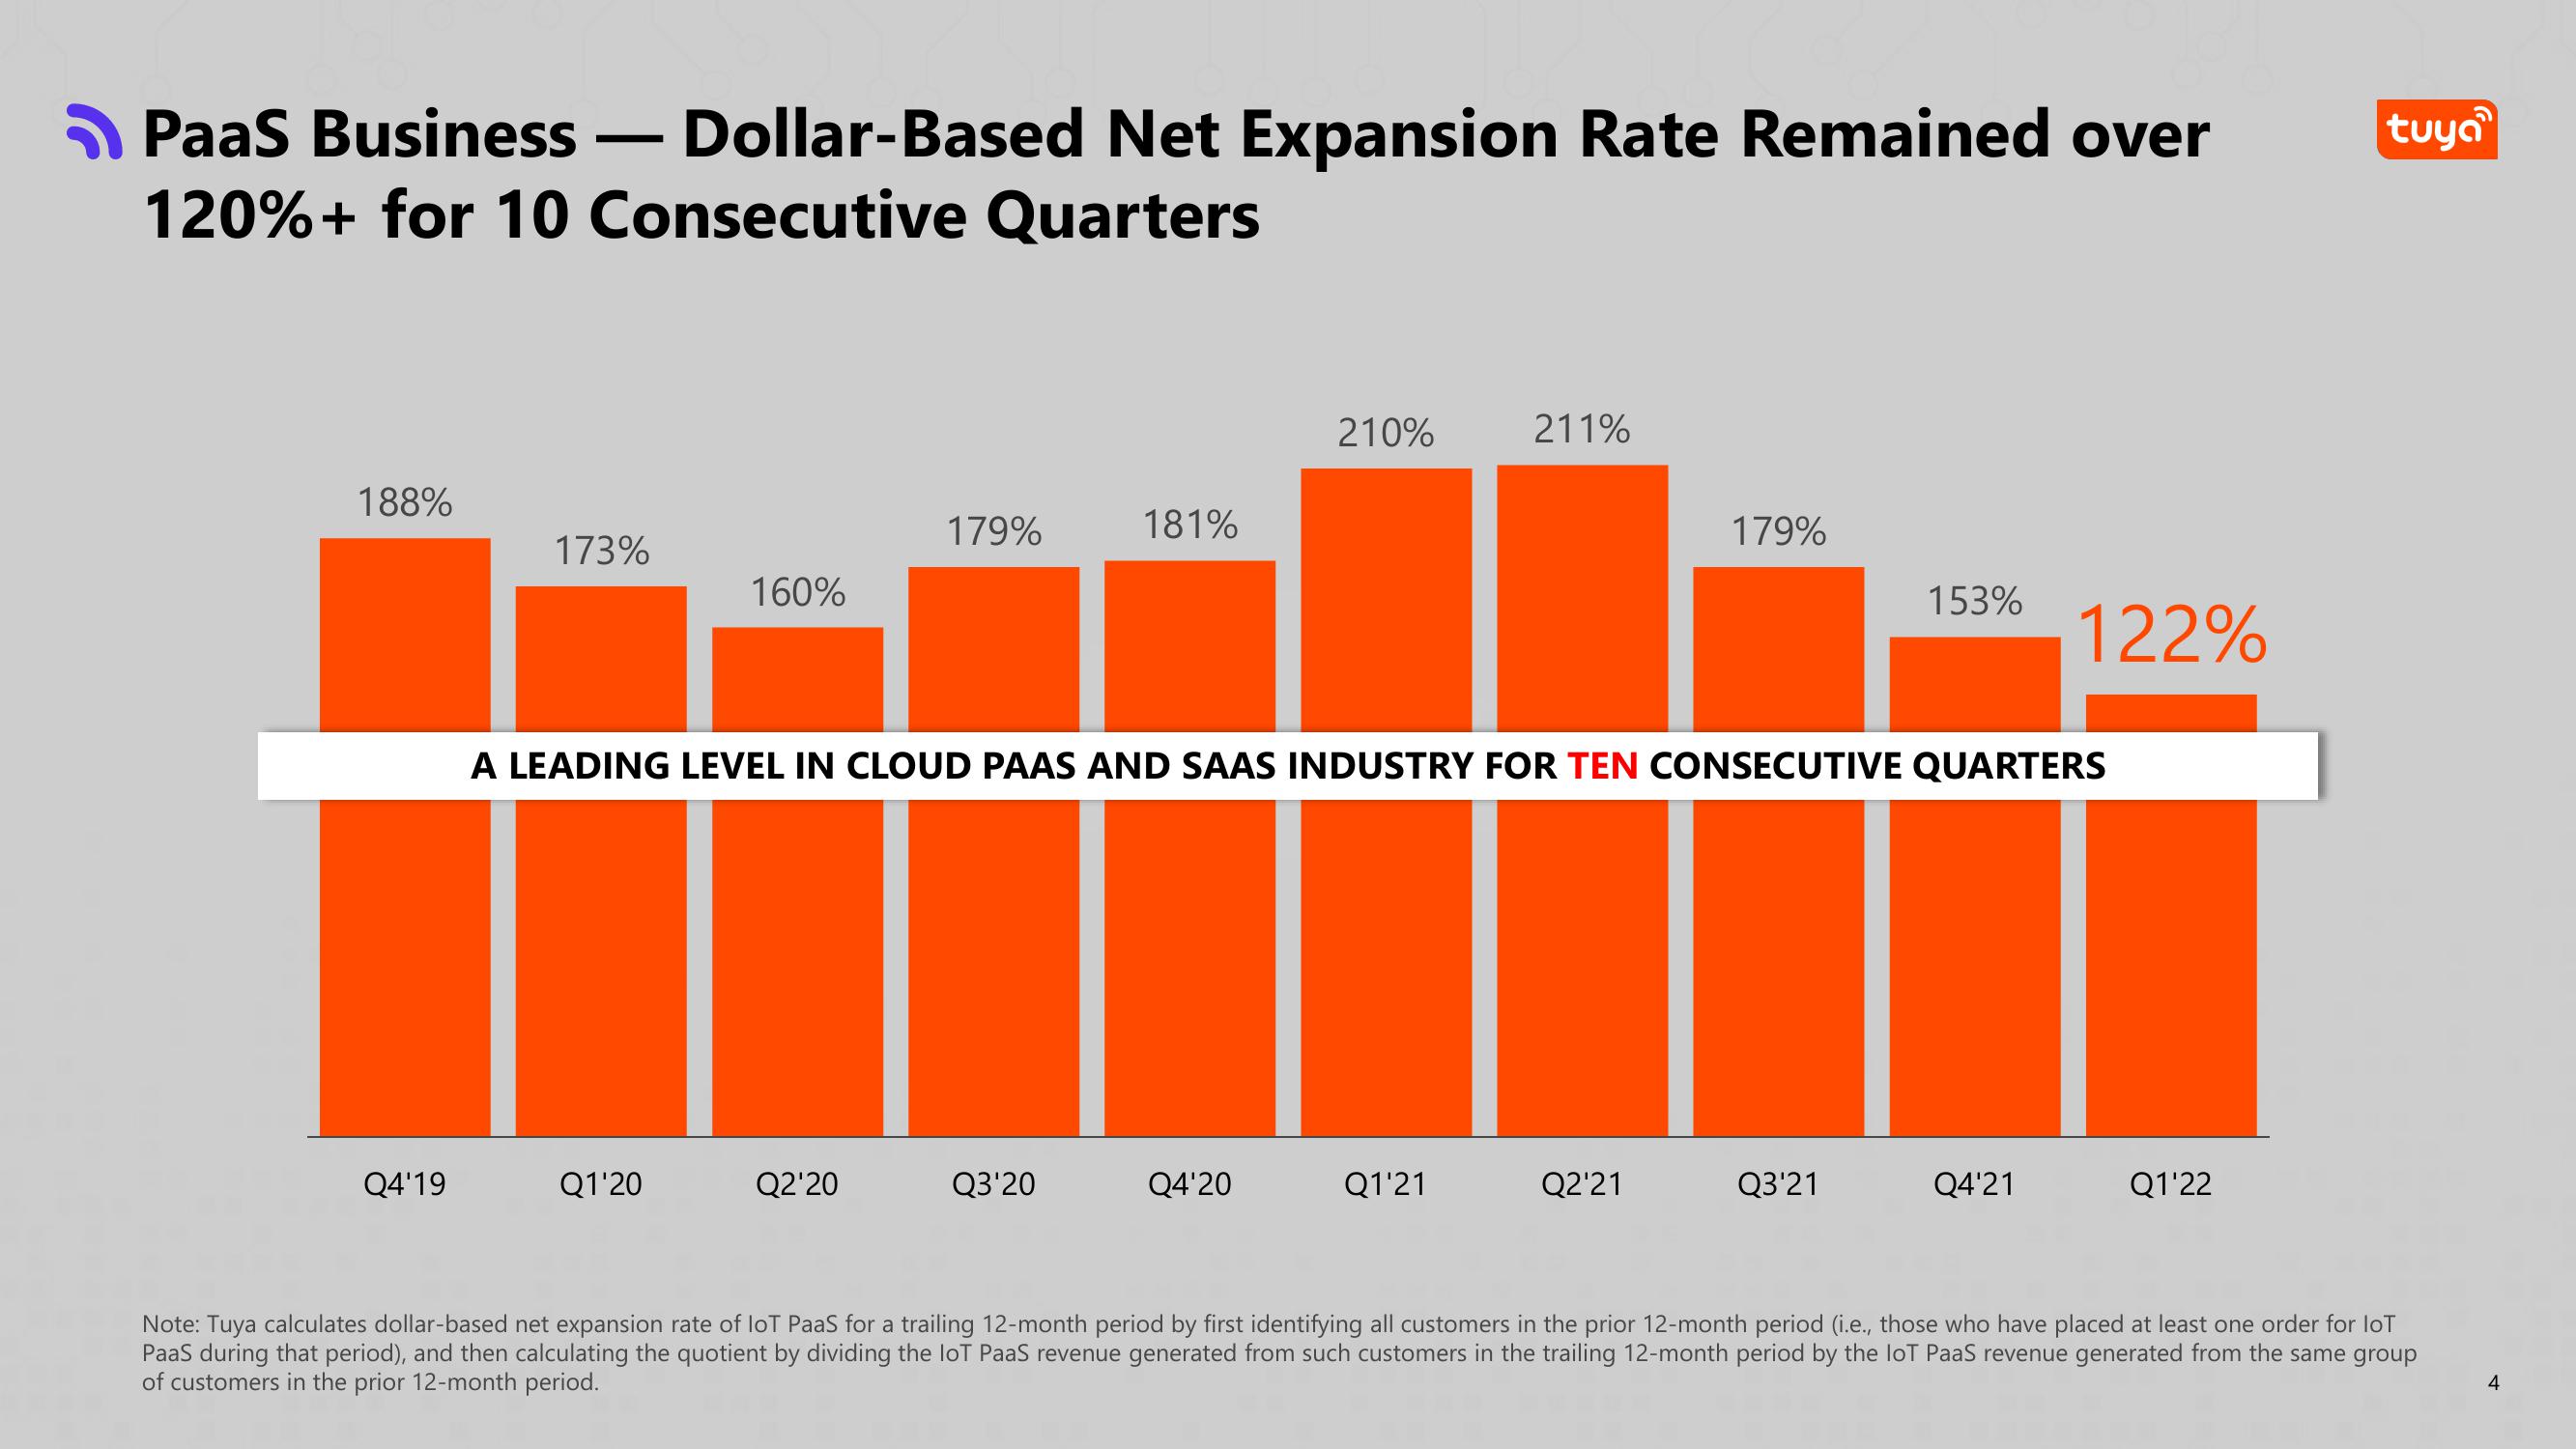
PaaS Business
120%+ for 10 Consecutive Quarters
188%
Q4'19
-
173%
Dollar-Based Net Expansion Rate Remained over
Q1'20
160%
179%
Q2'20
181%
Q3'20
210%
A LEADING LEVEL IN CLOUD PAAS AND SAAS INDUSTRY FOR TEN CONSECUTIVE QUARTERS
Q4'20
211%
Q1'21
179%
Q2'21
153% 122%
Q3'21
Q4'21
Q1'22
tuya
Note: Tuya calculates dollar-based net expansion rate of loT PaaS for a trailing 12-month period by first identifying all customers in the prior 12-month period (i.e., those who have placed at least one order for loT
PaaS during that period), and then calculating the quotient by dividing the loT PaaS revenue generated from such customers in the trailing 12-month period by the loT PaaS revenue generated from the same group
of customers in the prior 12-month period.
4View entire presentation