LionTree Investment Banking Pitch Book
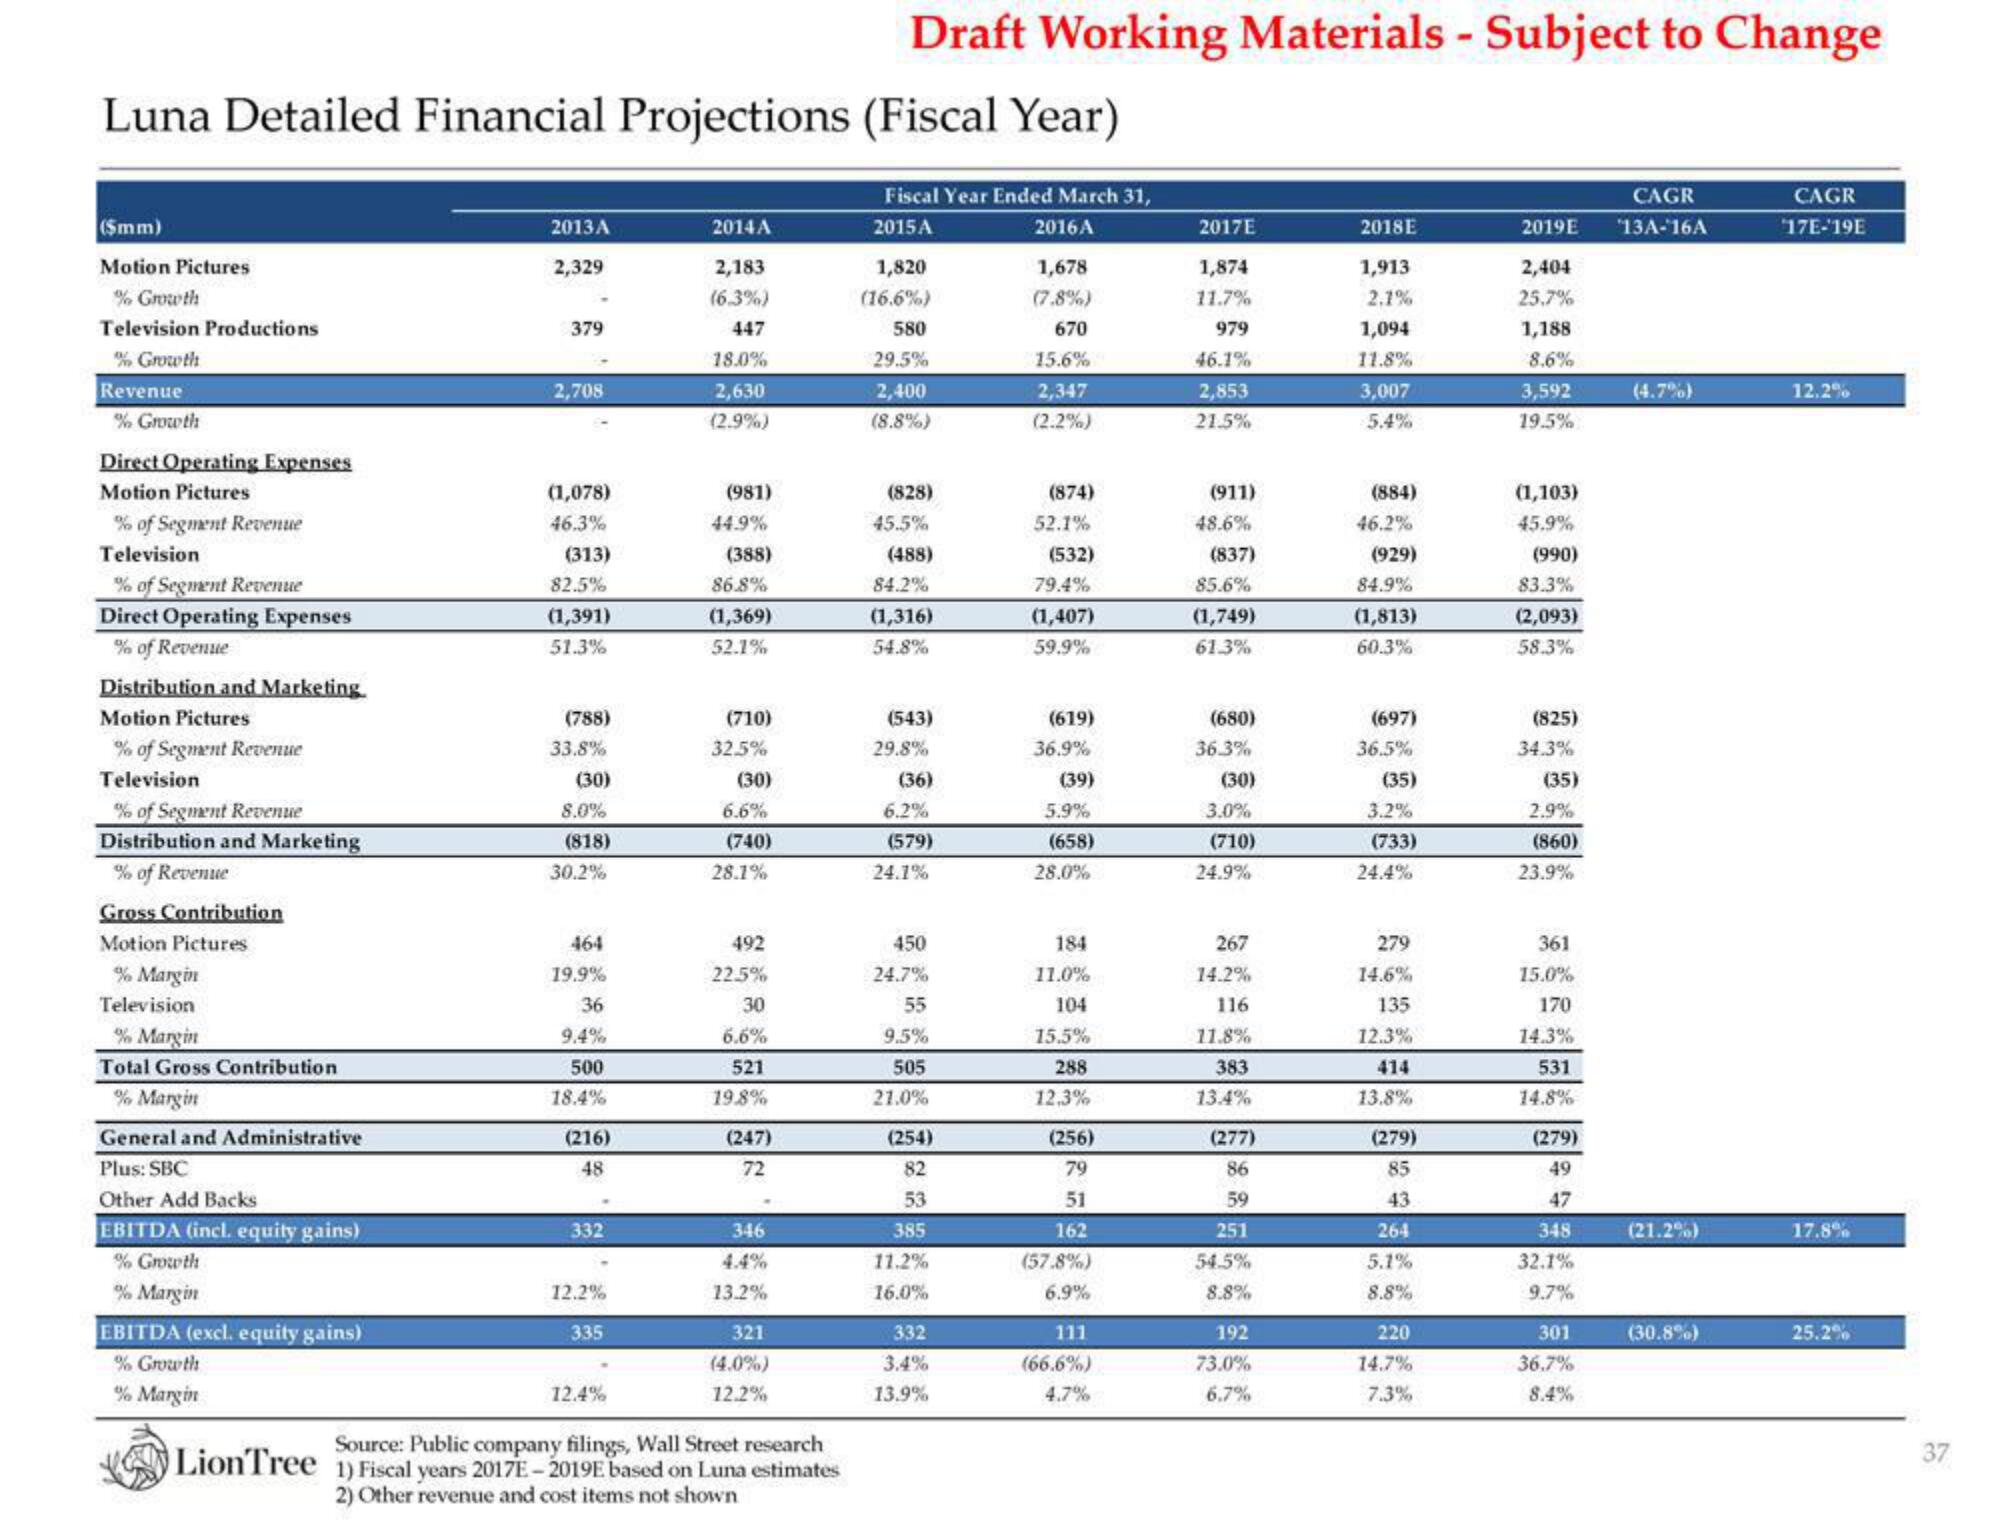
Luna Detailed Financial Projections (Fiscal Year)
Fiscal Year Ended March 31,
2016A
2015A
($mm)
Motion Pictures
% Growth
Television Productions
% Growth
Revenue
% Growth
Direct Operating Expenses
Motion Pictures
% of Segment Revenue
Television
% of Segment Revenue
Direct Operating Expenses
% of Revenue
Distribution and Marketing.
Motion Pictures
% of Segment Revenue
Television
% of Segment Revenue
Distribution and Marketing
% of Revenue
Gross Contribution
Motion Pictures
% Margin
Television
% Margin
Total Gross Contribution
% Margin
General and Administrative
Plus: SBC
Other Add Backs
EBITDA (incl. equity gains)
% Growth
% Margin
EBITDA (excl. equity gains)
% Growth
% Margin
2013A
2,329
379
2,708
(1,078)
46.3%
(313)
82.5%
(1,391)
51.3%
(788)
33.8%
(30)
8.0%
(818)
30.2%
464
19.9%
36
9.4%
500
18.4%
(216)
48
332
12.2%
335
12.4%
2014A
2,183
(6.3%)
447
18.0%
2,630
(2.9%)
(981)
44.9%
(388)
86.8%
(1,369)
52.1%
(710)
32.5%
(30)
6.6%
(740)
28.1%
492
22.5%
30
6.6%
521
19.8%
(247)
72
346
13.2%
321
(4.0%)
12.2%
Draft Working Materials - Subject to Change
Source: Public company filings, Wall Street research
LionTree 1) Fiscal years 2017E-2019E based on Luna estimates
2) Other revenue and cost items not shown
1,820
(16.6%)
580
29.5%
2,400
(8.8%)
(828)
45.5%
(488)
84.2%
(1,316)
54.8%
(543)
29.8%
(36)
6.2%
(579)
24.1%
450
24.7%
55
9.5%
505
21.0%
(254)
82
53
385
11.2%
16.0%
332
3.4%
13.9%
1,678
(7.8%)
670
15.6%
2,347
(2.2%)
(874)
52.1%
(532)
79.4%
(1,407)
59.9%
(619)
36.9%
(39)
5.9%
(658)
28.0%
184
11.0%
104
15.5%
288
12.3%
(256)
79
51
162
(57.8%)
6.9%
111
(66.6%)
4.7%
2017E
1,874
11.7%
979
46.1%
2,853
21.5%
(911)
48.6%
(837)
85.6%
(1,749)
61.3%
(680)
36.3%
(30)
3.0%
(710)
24.9%
267
14.2%
116
11.8%
383
13.4%
(277)
86
59
251
54.5%
8.8%
192
73.0%
6.7%
2018E
1,913
2.1%
1,094
11.8%
3,007
5.4%
(884)
46.2%
(929)
84.9%
(1,813)
60.3%
(697)
36.5%
(35)
3.2%
(733)
24.4%
279
14.6%
135
12.3%
13.8%
(279)
85
43
264
5.1%
8.8%
220
14.7%
7.3%
CAGR
2019E $13A-16A
2,404
25.7%
1,188
8.6%
3,592
19.5%
(1,103)
45.9%
(990)
83.3%
(2,093)
58.3%
(825)
34.3%
(35)
2.9%
(860)
23.9%
361
15.0%
170
14.3%
531
14.8%
(279)
49
47
348
32.1%
9.7%
301
36.7%
8.4%
(4.7%)
(21.2%)
(30.8%)
CAGR
17E-19E
12.2%
17.8%
25.2%
37View entire presentation