Q2 Quarter 2023
Securities Portfolio: Highly rated portfolio and balance sheet optimization funding source
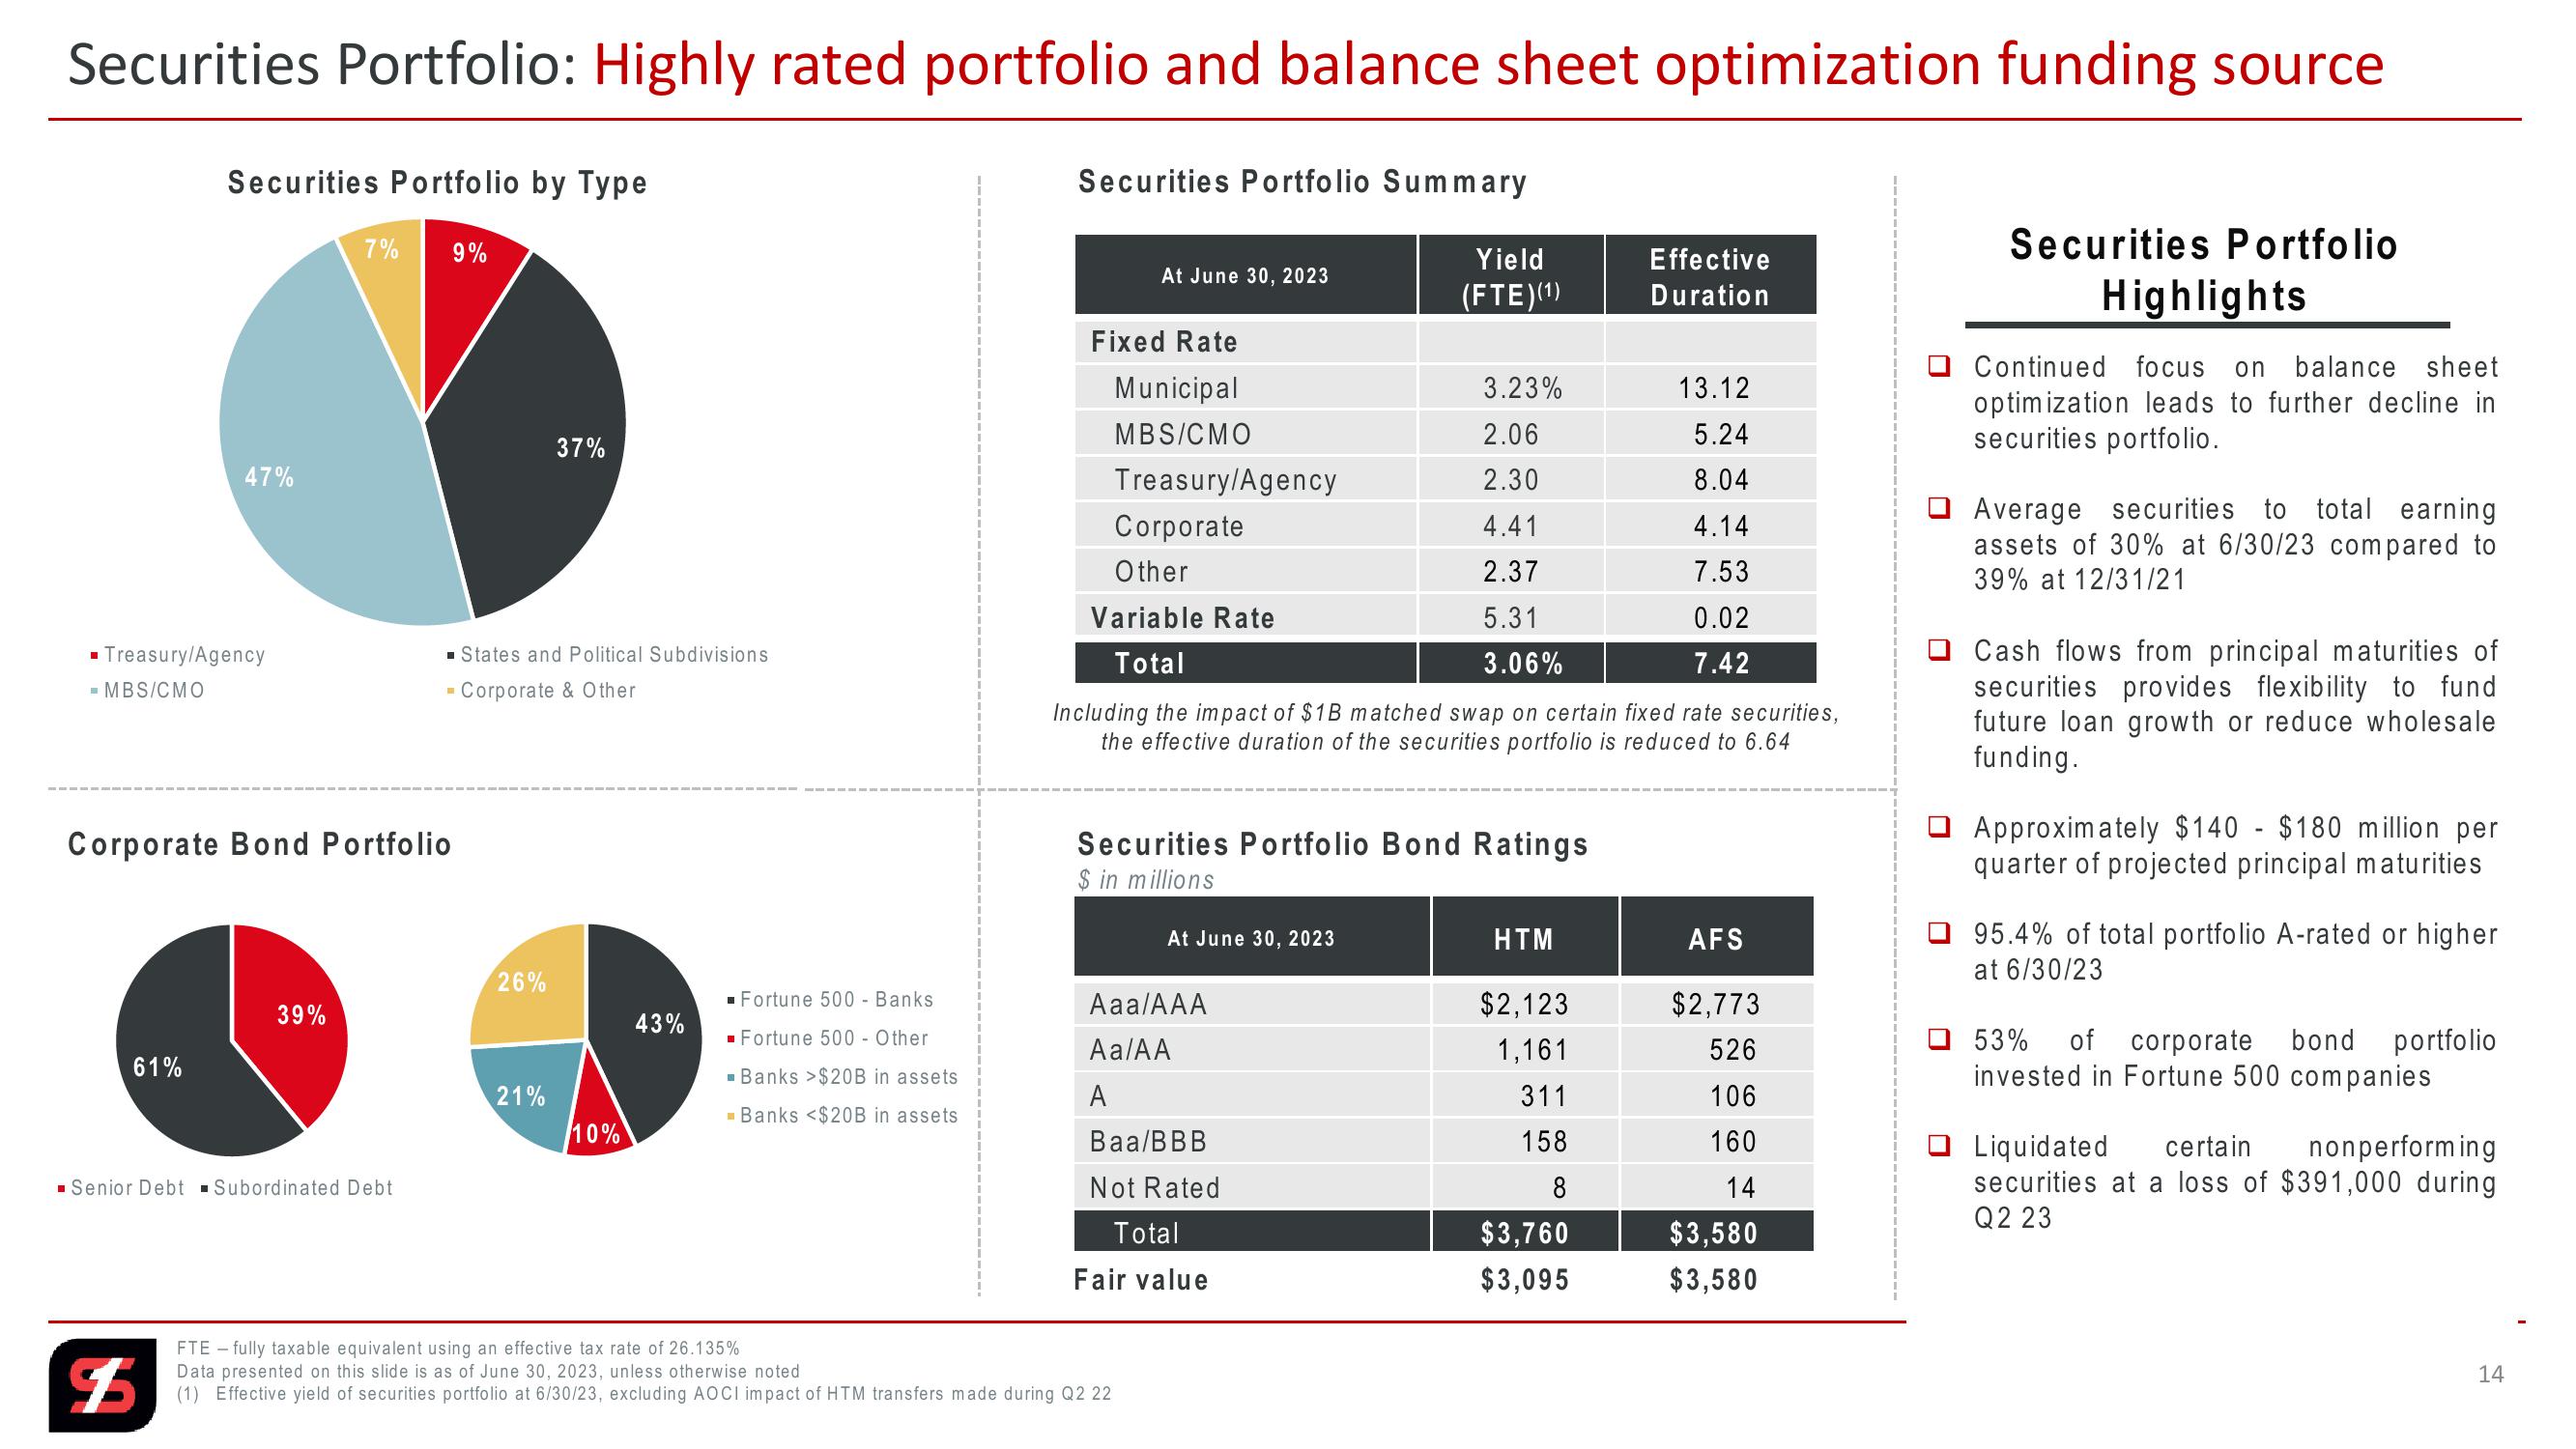
Securities Portfolio by Type
Securities Portfolio Summary
47%
■Treasury/Agency
■ MBS/CMO
7%
9%
Corporate Bond Portfolio
37%
■States and Political Subdivisions
Corporate & Other
At June 30, 2023
Yield
(FTE)(1)
Effective
Duration
Fixed Rate
Municipal
3.23%
13.12
MBS/CMO
2.06
5.24
Treasury/Agency
2.30
8.04
Corporate
4.41
4.14
Other
2.37
7.53
Variable Rate
5.31
0.02
Total
3.06%
7.42
Including the impact of $1B matched swap on certain fixed rate securities,
the effective duration of the securities portfolio is reduced to 6.64
Securities Portfolio Bond Ratings
$ in millions
At June 30, 2023
HTM
AFS
26%
■ Fortune 500 - Banks
39%
Aaa/AAA
$2,123
$2,773
43%
61%
21%
Fortune 500 - Other
■Banks >$20B in assets
■Banks <$20B in assets
Aa/AA
1,161
526
A
311
106
10%
Baa/BBB
158
160
■Senior Debt Subordinated Debt
Not Rated
8
14
Total
$3,760
$3,580
Fair value
$3,095
$3,580
Securities Portfolio
Highlights
Continued focus on balance sheet
optimization leads to further decline in
securities portfolio.
Average securities to total earning
assets of 30% at 6/30/23 compared to
39% at 12/31/21
Cash flows from principal maturities of
securities provides flexibility to fund
future loan growth or reduce wholesale
funding.
Approximately $140 $180 million per
quarter of projected principal maturities
95.4% of total portfolio A-rated or higher
at 6/30/23
53% of corporate
bond portfolio
invested in Fortune 500 companies
Liquidated certain nonperforming
securities at a loss of $391,000 during
Q2 23
FTE - fully taxable equivalent using an effective tax rate of 26.135%
$
Data presented on this slide is as of June 30, 2023, unless otherwise noted
(1) Effective yield of securities portfolio at 6/30/23, excluding AOCI impact of HTM transfers made during Q2 22
14View entire presentation