LandSea Homes Investor Presentation
37
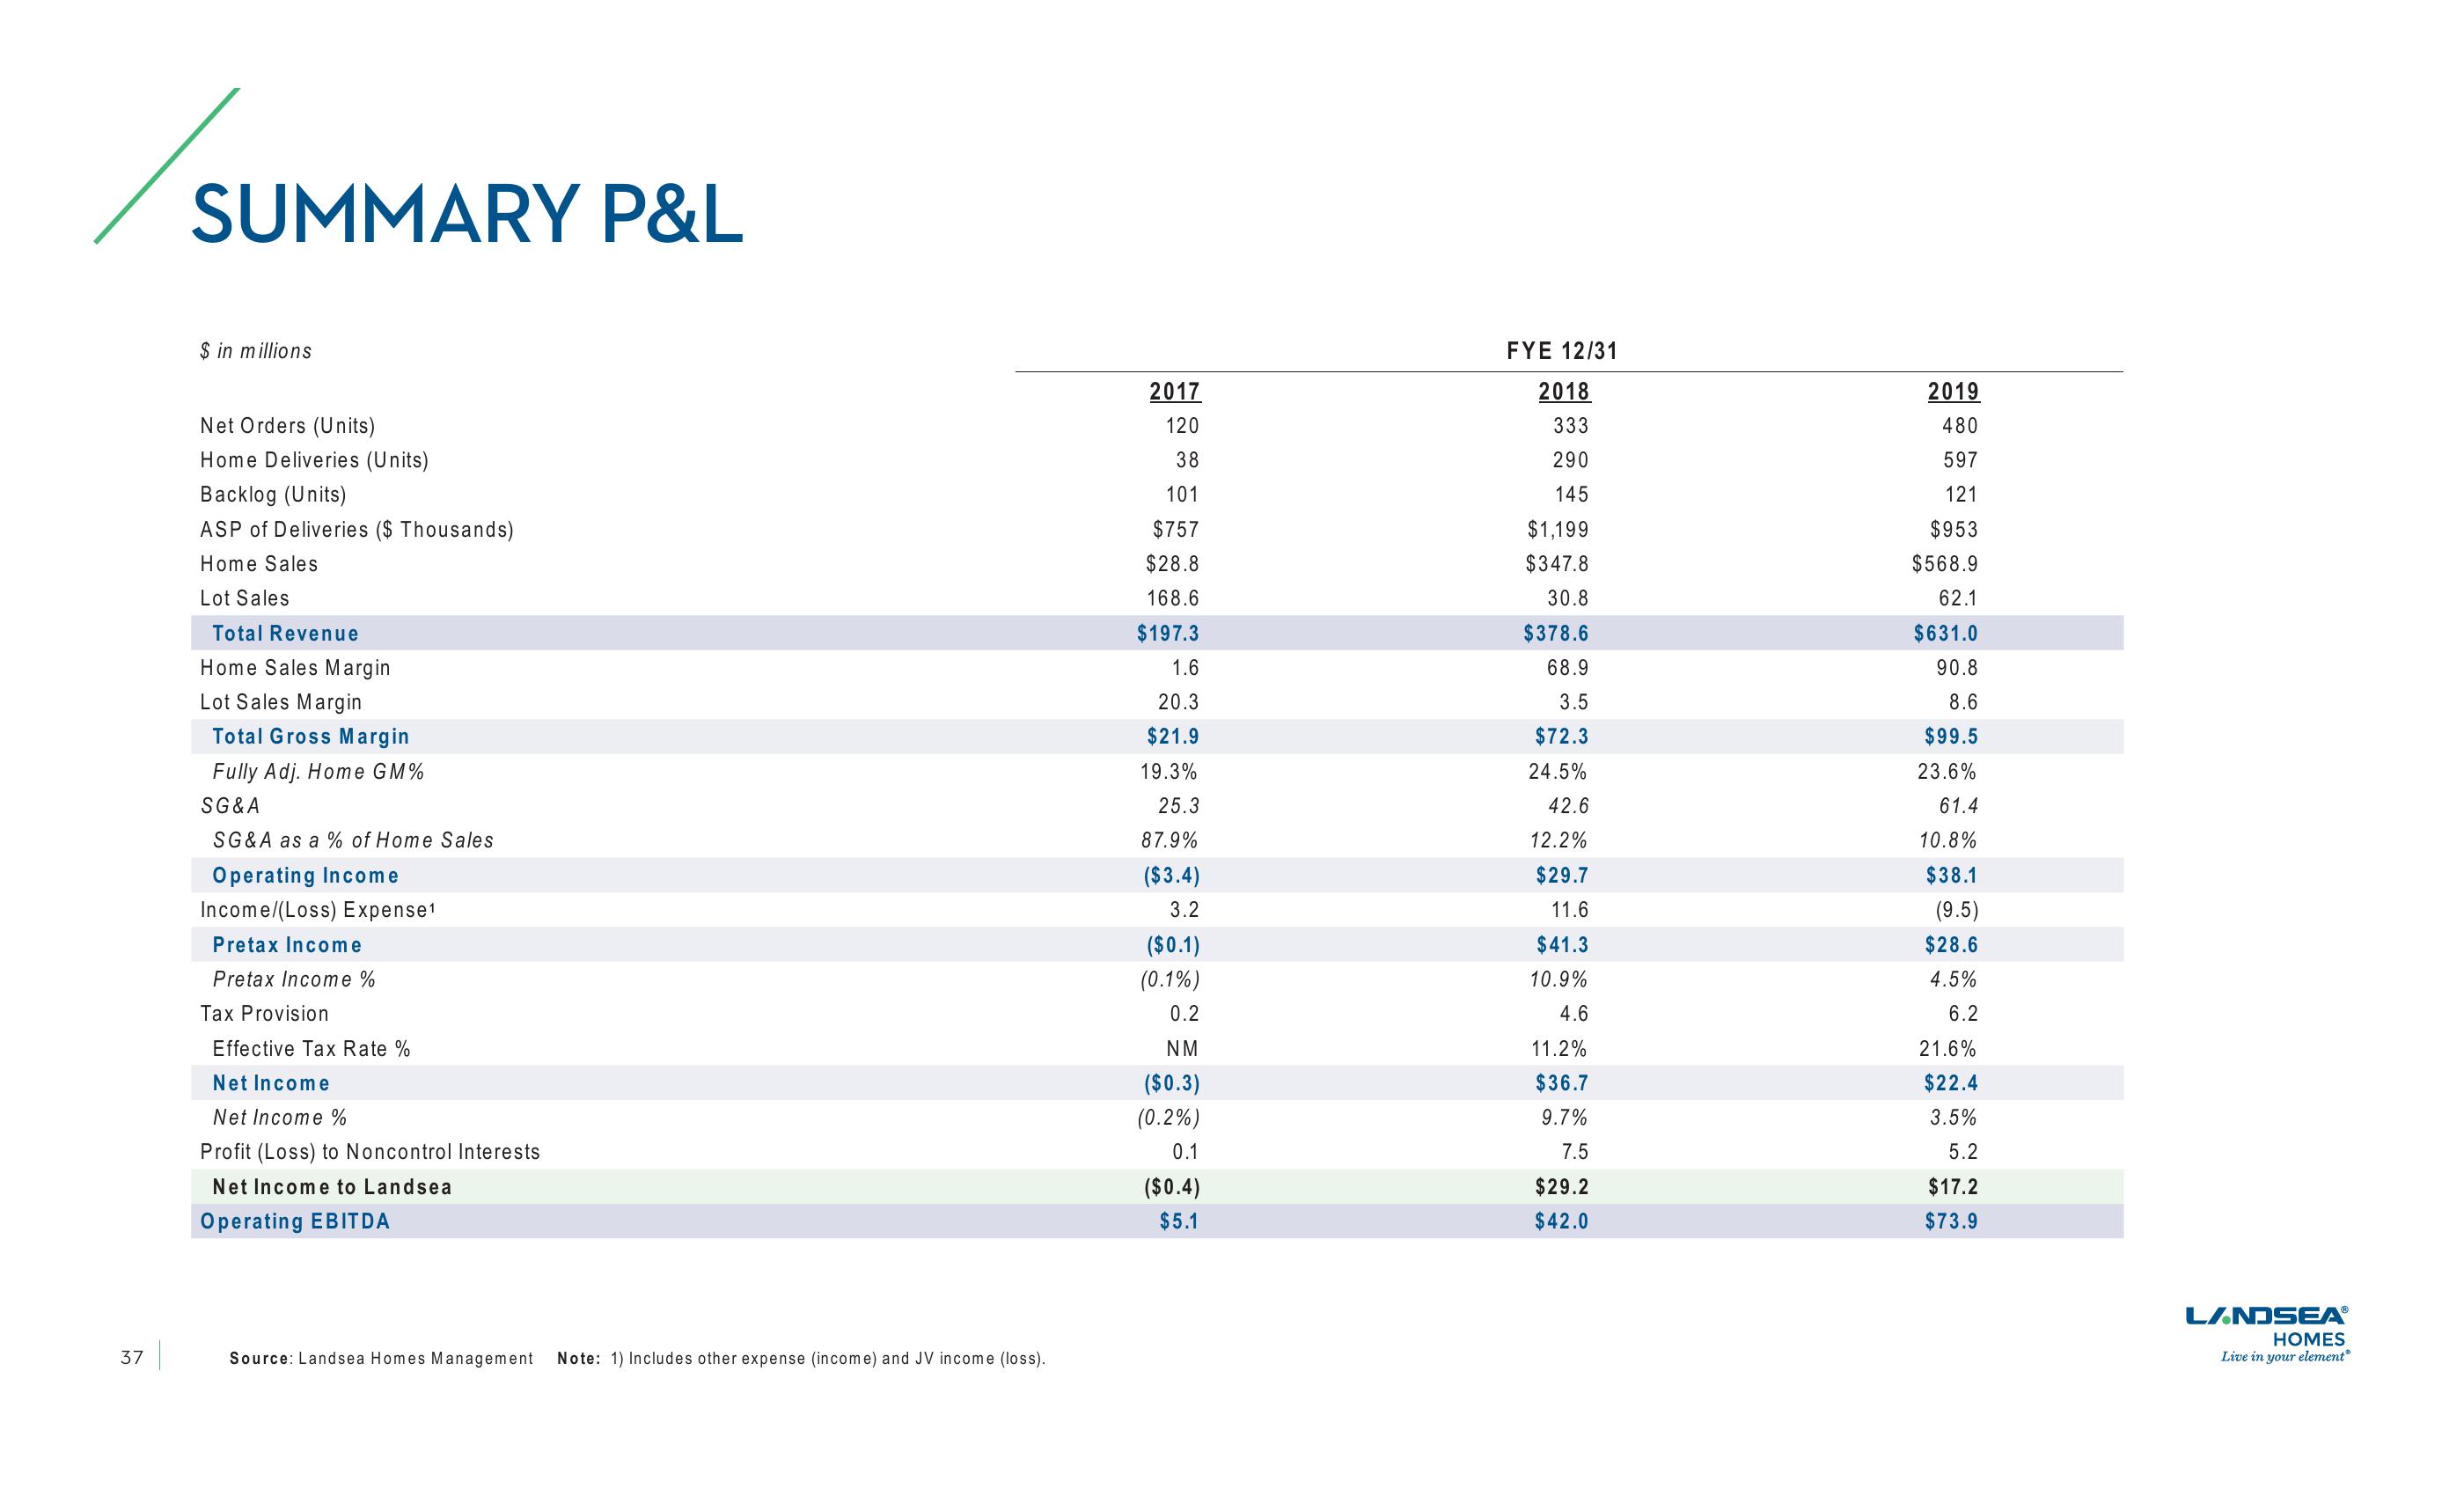
SUMMARY P&L
$ in millions
Net Orders (Units)
Home Deliveries (Units)
Backlog (Units)
ASP of Deliveries ($ Thousands)
Home Sales
Lot Sales
Total Revenue
Home Sales Margin
Lot Sales Margin
Total Gross Margin
Fully Adj. Home GM%
SG&A
SG&A as a % of Home Sales
Operating Income
Income/(Loss) Expense¹
Pretax Income
Pretax Income %
Tax Provision
Effective Tax Rate %
Net Income
Net Income %
Profit (Loss) to Noncontrol Interests
Net Income to Landsea
Operating EBITDA
Source: Landsea Homes Management Note: 1) Includes other expense (income) and JV income (loss).
2017
120
38
101
$757
$28.8
168.6
$197.3
1.6
20.3
$21.9
19.3%
25.3
87.9%
($3.4)
3.2
($0.1)
(0.1%)
0.2
NM
($0.3)
(0.2%)
0.1
($0.4)
$5.1
FYE 12/31
2018
333
290
145
$1,199
$347.8
30.8
$378.6
68.9
3.5
$72.3
24.5%
42.6
12.2%
$29.7
11.6
$41.3
10.9%
4.6
11.2%
$36.7
9.7%
7.5
$29.2
$42.0
2019
480
597
121
$953
$568.9
62.1
$631.0
90.8
8.6
$99.5
23.6%
61.4
10.8%
$38.1
(9.5)
$28.6
4.5%
6.2
21.6%
$22.4
3.5%
5.2
$17.2
$73.9
LANDSEAⓇ®
HOMES
Live in your element®View entire presentation